plantMASST

plantMASST is a domain-specific MASST in which users can search MS/MS spectra against a public MS/MS database comprising taxonomically defined plant extracts. The interface offers two tabs: a Search tab to query the database with a spectrum, and a PlantMASST Explorer tab to browse the entire collection without a query spectrum.
Using plantMASST
plantMASST Explorer
Alongside the Search tab, the plantMASST interface includes a plantMASST Explorer tab that gives a bird's-eye view of the entire plantMASST collection: every plant taxon, its taxonomic lineage, and the number of mass spectrometry files associated with it. From there, the user can inspect the individual files and launch downstream analyses, such as Molecular Networking, without needing a query spectrum.
Navigating to the Explorer
On the plantMASST page, two tabs are shown just below the navigation bar: Search (the original spectrum search interface, unchanged) and plantMASST Explorer (the browsing interface). Clicking plantMASST Explorer switches to the new view.
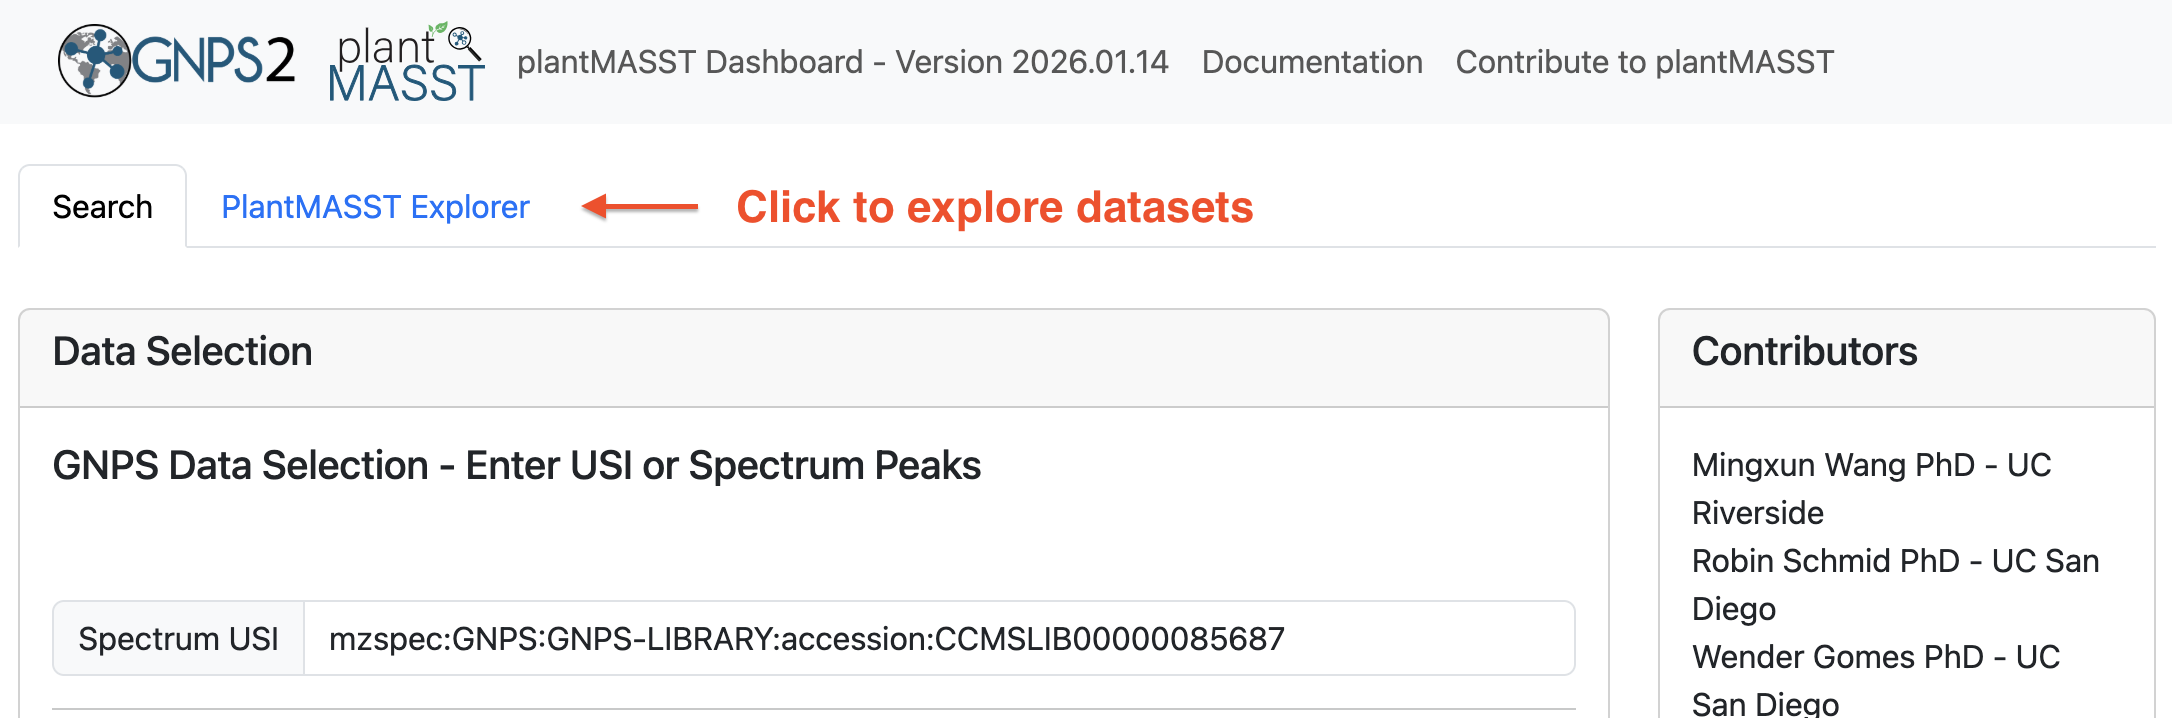 Figure 1. Tab bar showing the "Search" and "plantMASST Explorer" tabs, with "plantMASST Explorer" selected.
The Explorer table
The Explorer table displays one row per plant taxon present in the plantMASST database (~4,000 taxa). Each row shows:
| Column | Description |
|---|---|
| TaxID (NCBI) | The NCBI taxonomy identifier for the taxon |
| Species | Species name |
| Genus | Genus name |
| Family | Family name |
| Order | Order name |
| Class | Class name |
| Phylum | Phylum name |
| Kingdom | Kingdom name |
| File Count | Number of mass spectrometry files associated with this taxon |
The table is sorted by File Count (highest first) by default, so the best-represented taxa appear at the top.
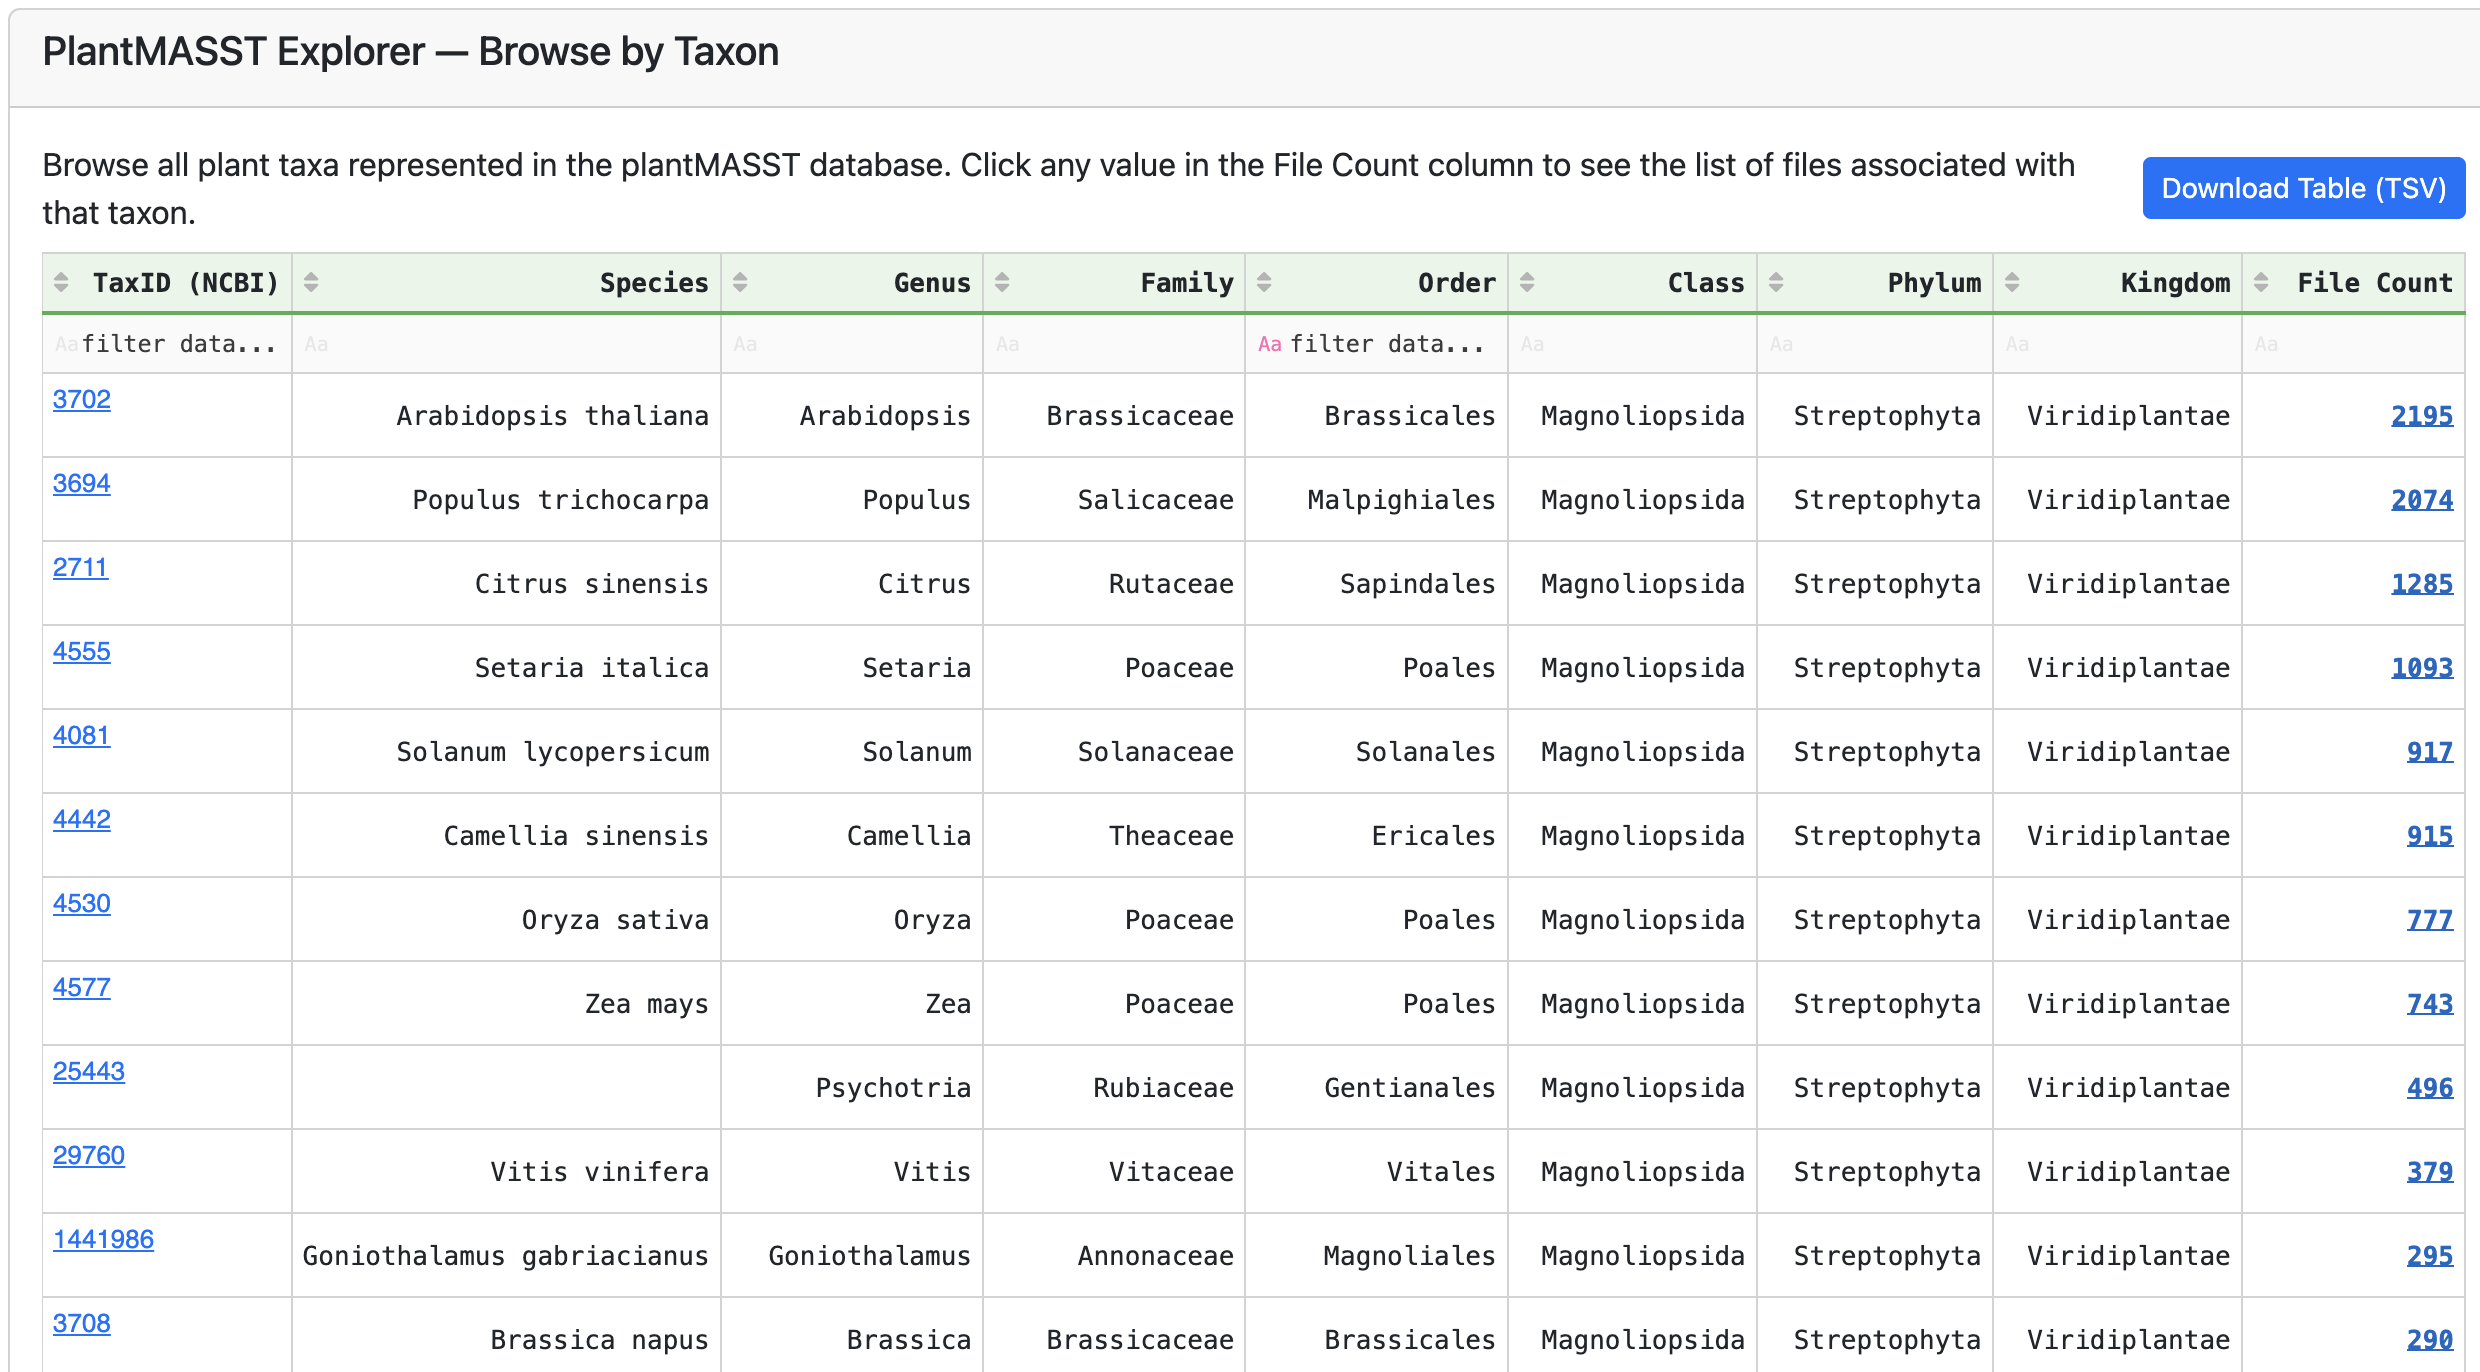 Figure 2. The full Explorer table with all columns visible, showing the first page of results sorted by File Count descending.
Sorting
Clicking any column header sorts the table by that column; clicking again reverses the sort order. This is useful, for example, for finding all taxa within a specific family sorted alphabetically by species name.
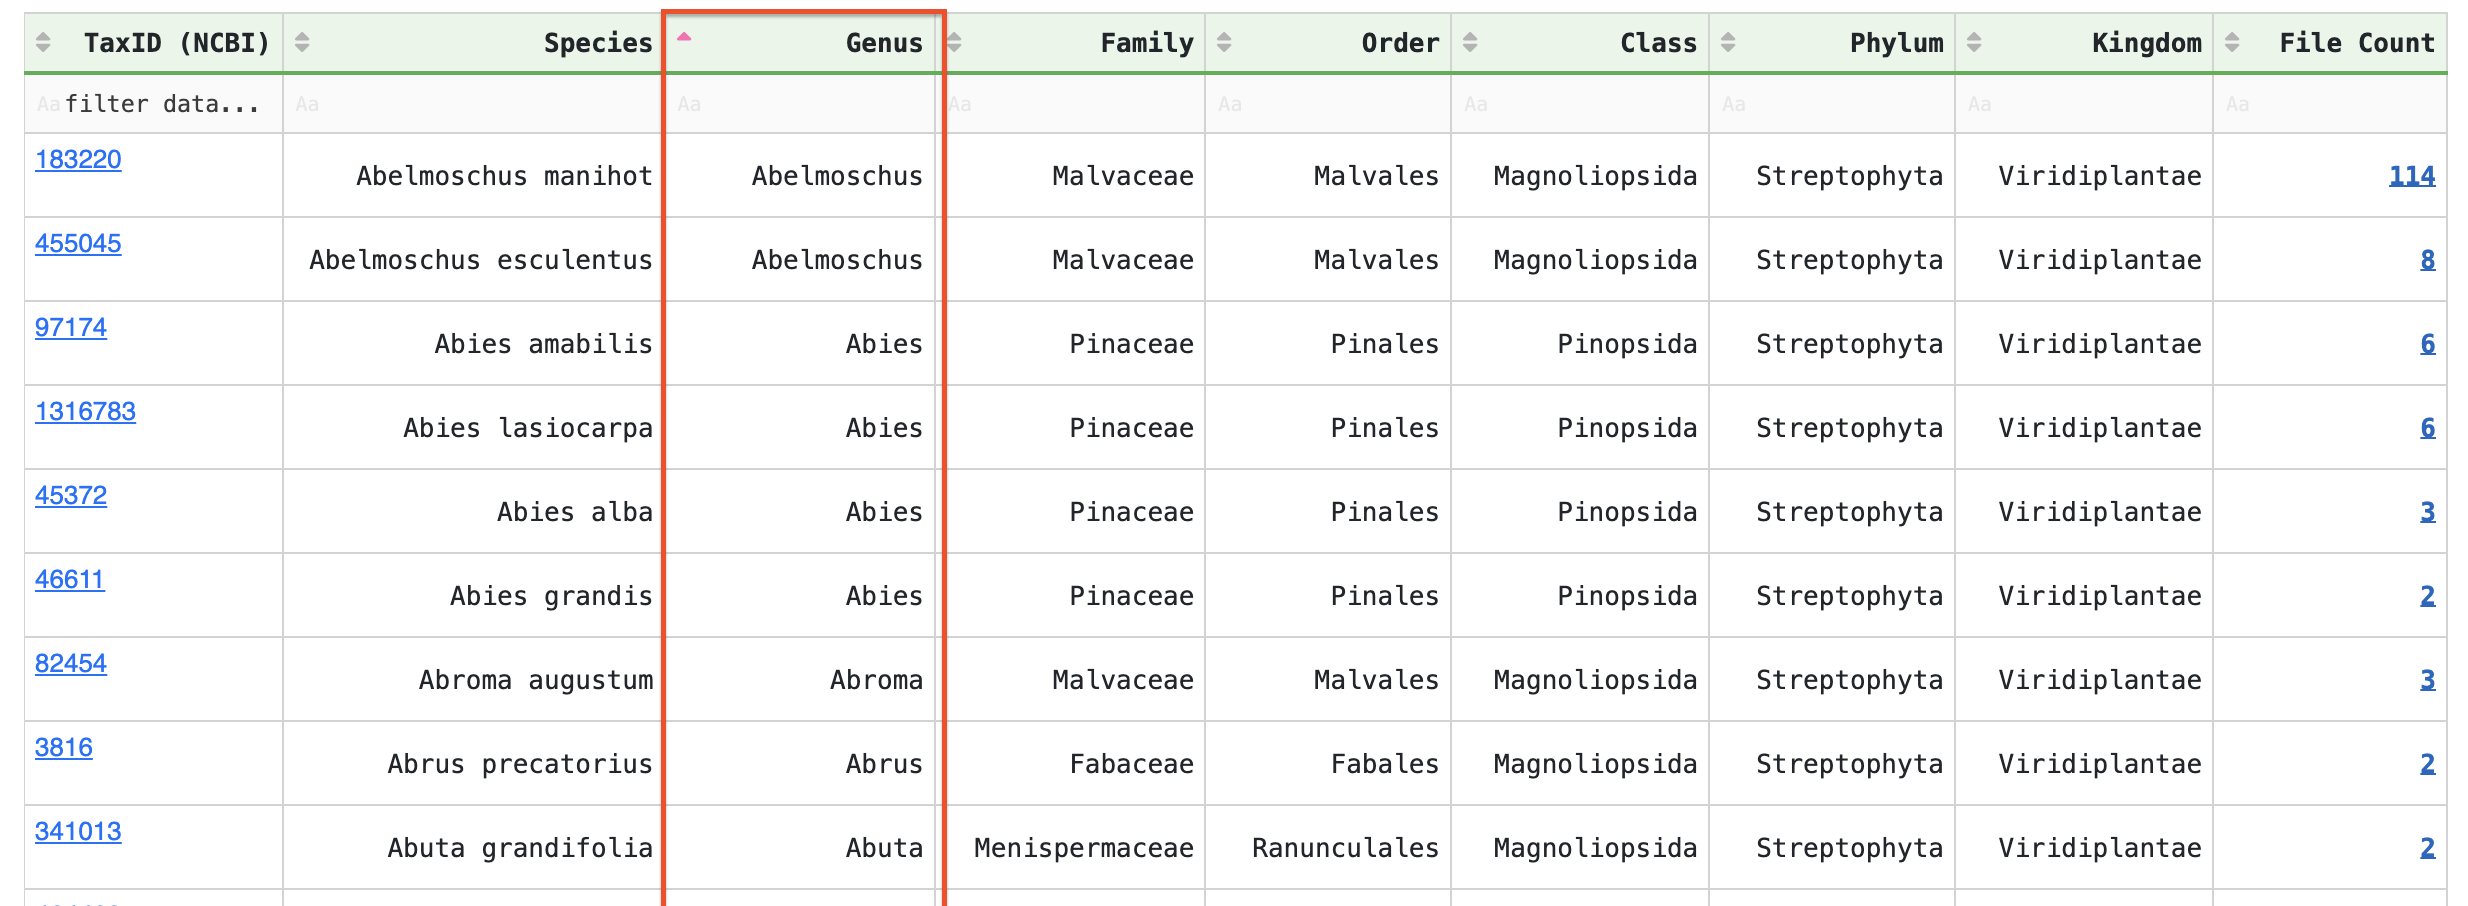 Figure 3. The Explorer table sorted alphabetically by the "Genus" column.
Filtering
Each column has a filter input row directly below the header. Typing in any filter box narrows the results. Filtering is case-insensitive — typing rosaceae will match Rosaceae.
Filters can be combined across multiple columns simultaneously. For example, filtering Phylum by Streptophyta and Family by Fabaceae shows only legumes within that phylum.
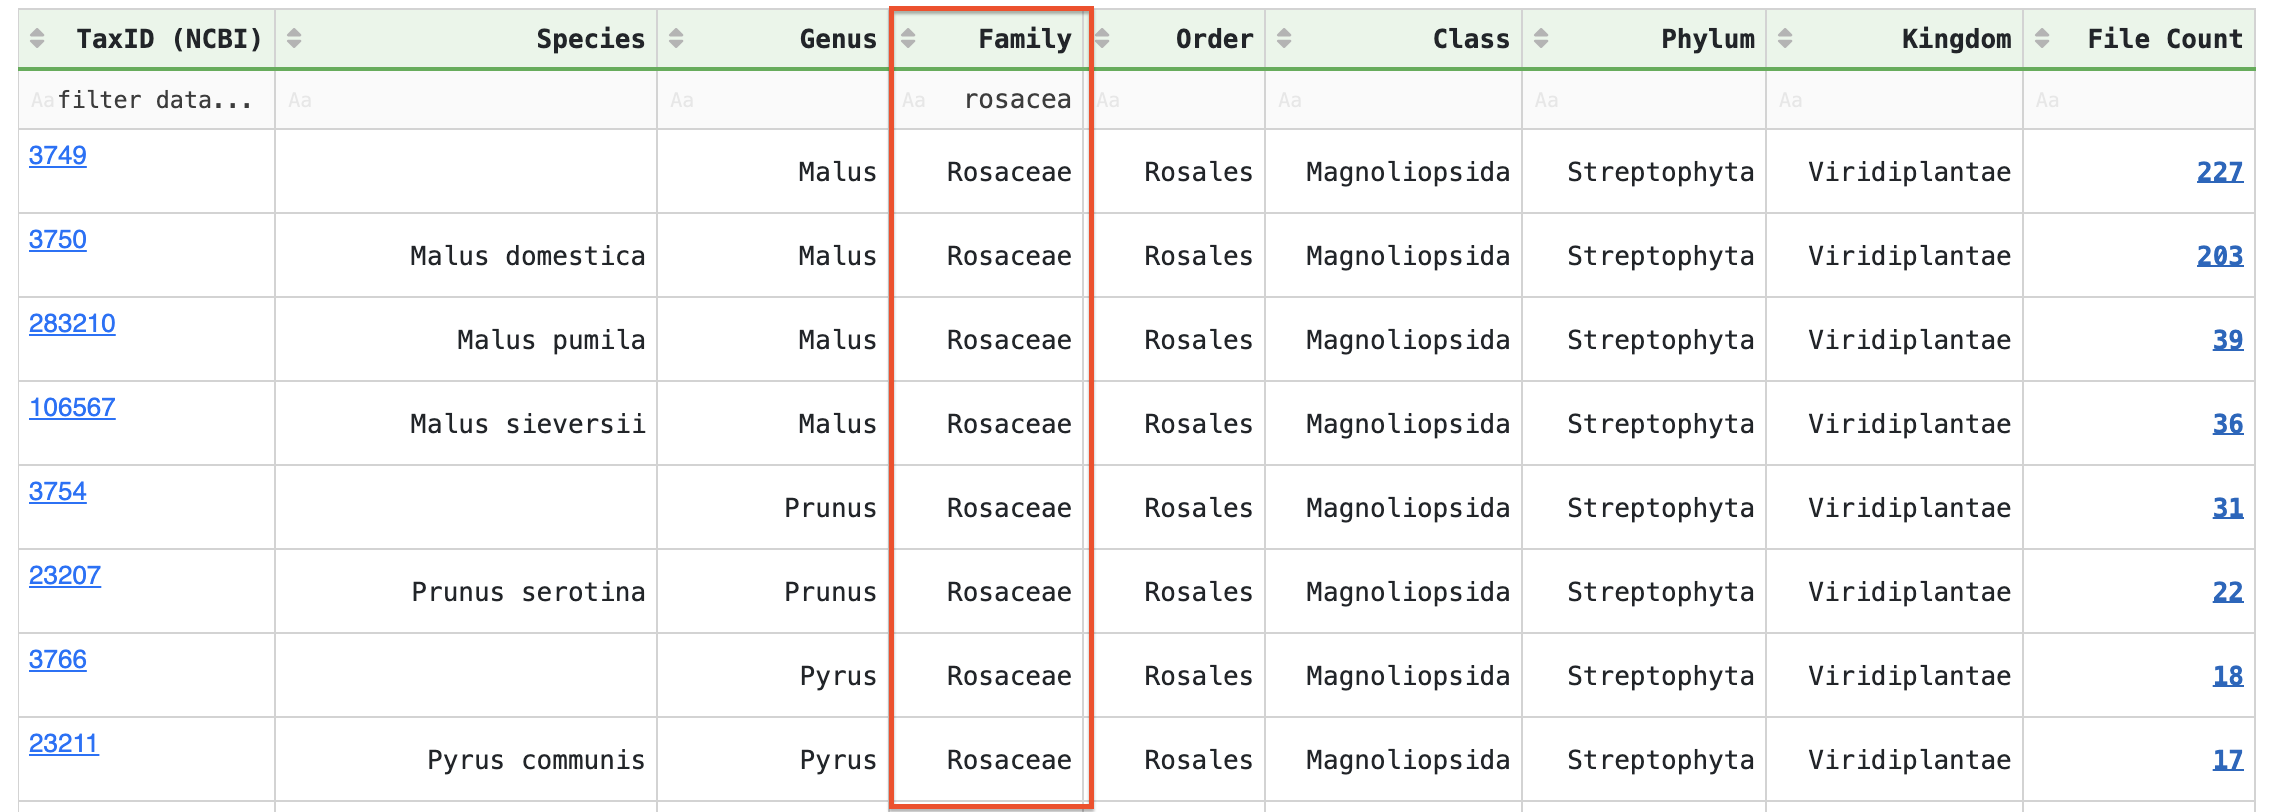 Figure 4. The Explorer table with a filter applied in the "Family" column (e.g. "Rosaceae"), showing only matching rows.
Inspecting files for a taxon
The File Count values are clickable. Clicking any number in that column (shown as a blue, underlined value) opens a detail panel listing all the mass spectrometry files associated with that taxon. The modal window shows a header with the TaxID and species/genus name, and a paginated, sortable, filterable table of the individual files.
Each file row shows:
| Column | Description |
|---|---|
| Filename | Short file name within the MassIVE dataset |
| MassIVE | The MassIVE dataset identifier (e.g. MSV000078770) |
| File USI | The Universal Spectrum Identifier for the file, usable in GNPS2 tools |
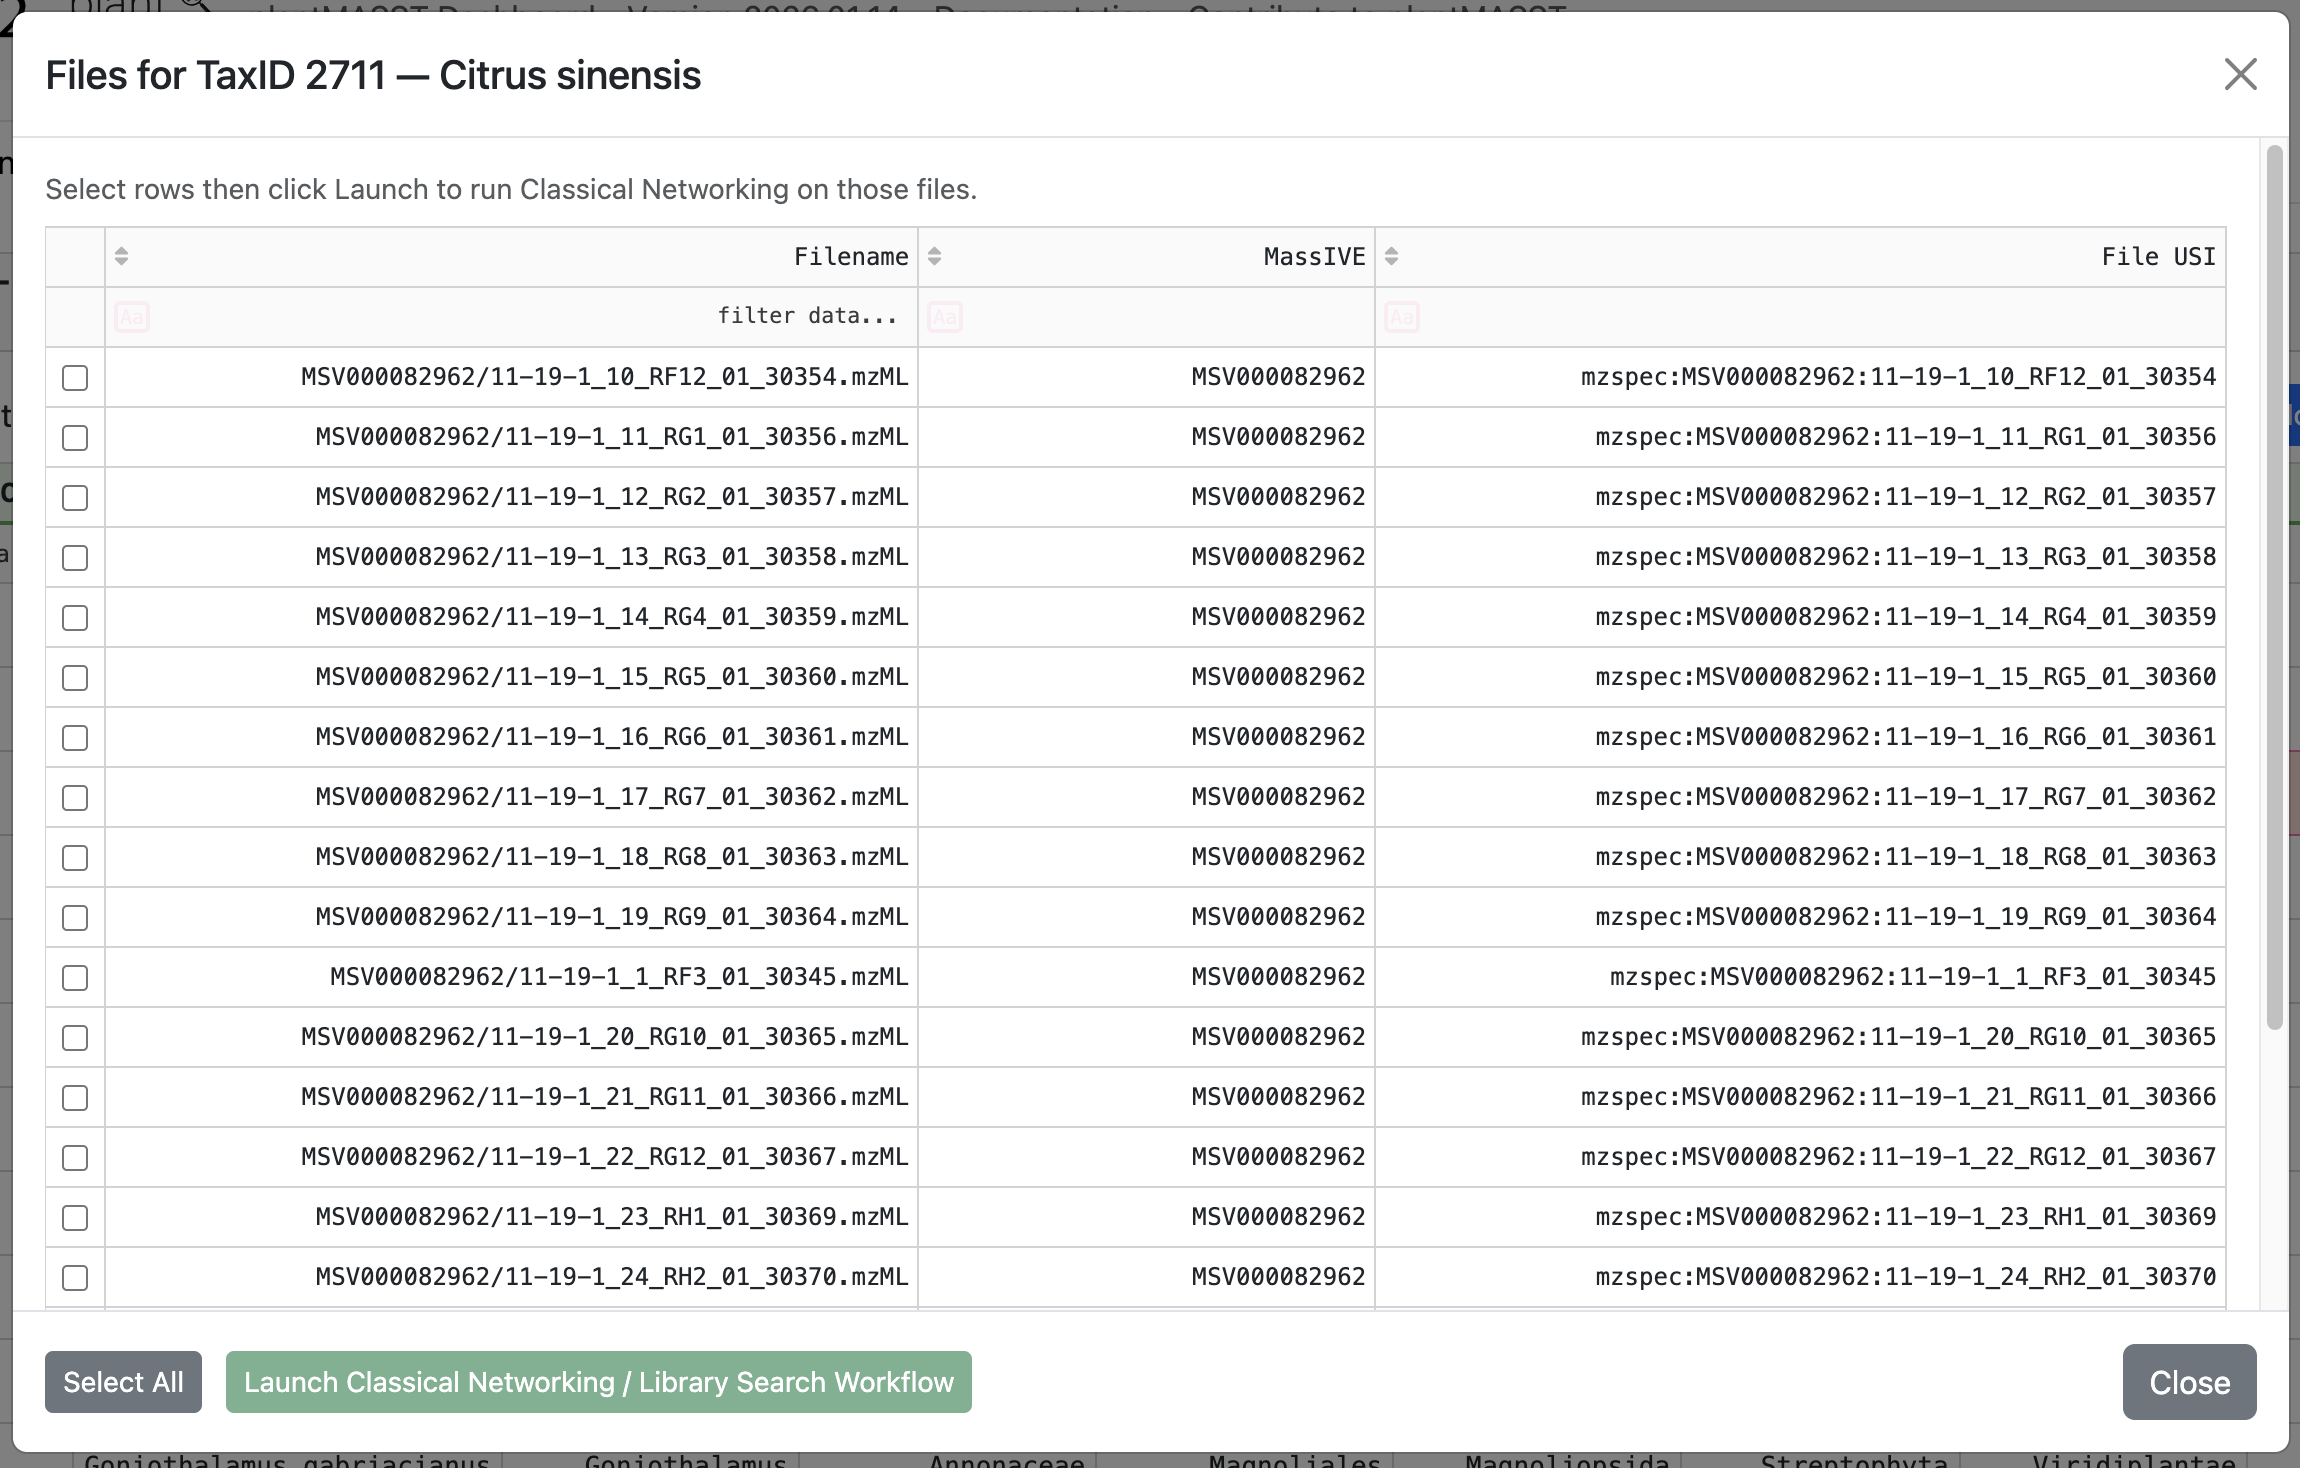 Figure 5. The file detail modal open, showing the header with the taxon name and the file list table.
Selecting files and launching Classical Networking
The user can select one or more files in the modal and send them directly to the Classical Molecular Networking workflow on GNPS2.
Important note
For this step a GNPS2 account is required. We recommend logging in to your GNPS2 account before proceeding. You can request an account if you do not have one yet.
Selecting individual files. Clicking the checkbox on the left side of any row selects it; selected rows are highlighted. Rows can be selected across multiple pages.
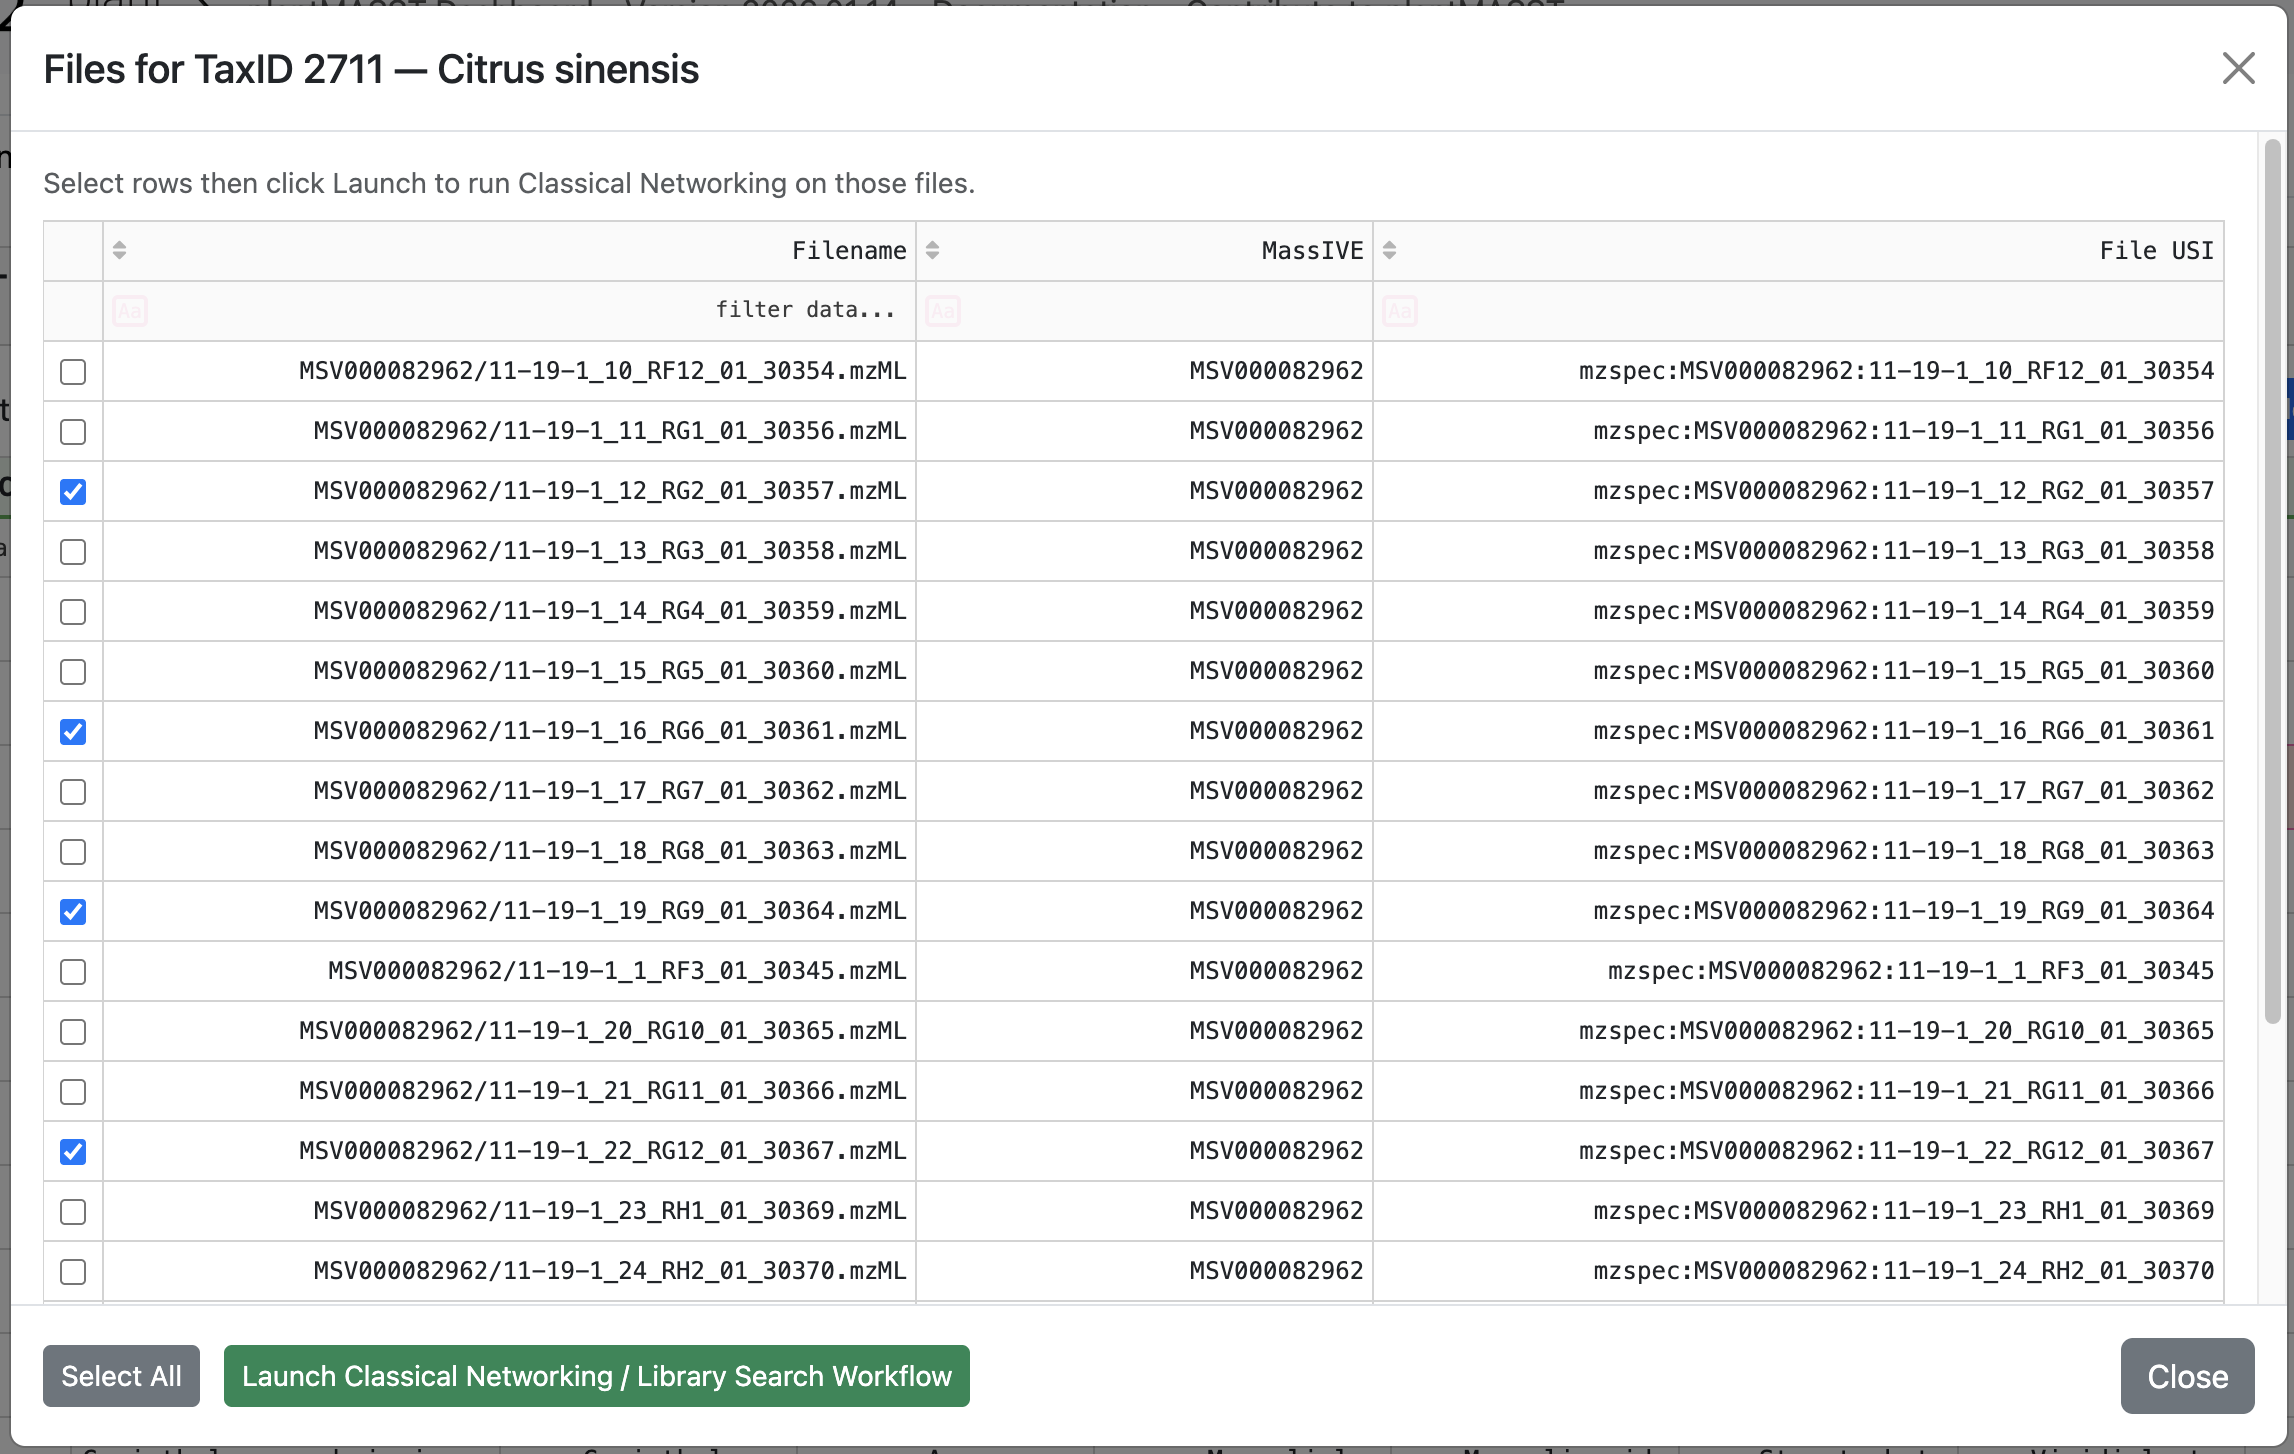 Figure 6. The modal with individual rows selected (checkboxes ticked), showing the selected rows highlighted.
Selecting all files at once. Clicking the Select All button in the modal footer selects every file for that taxon; clicking it again deselects all rows.
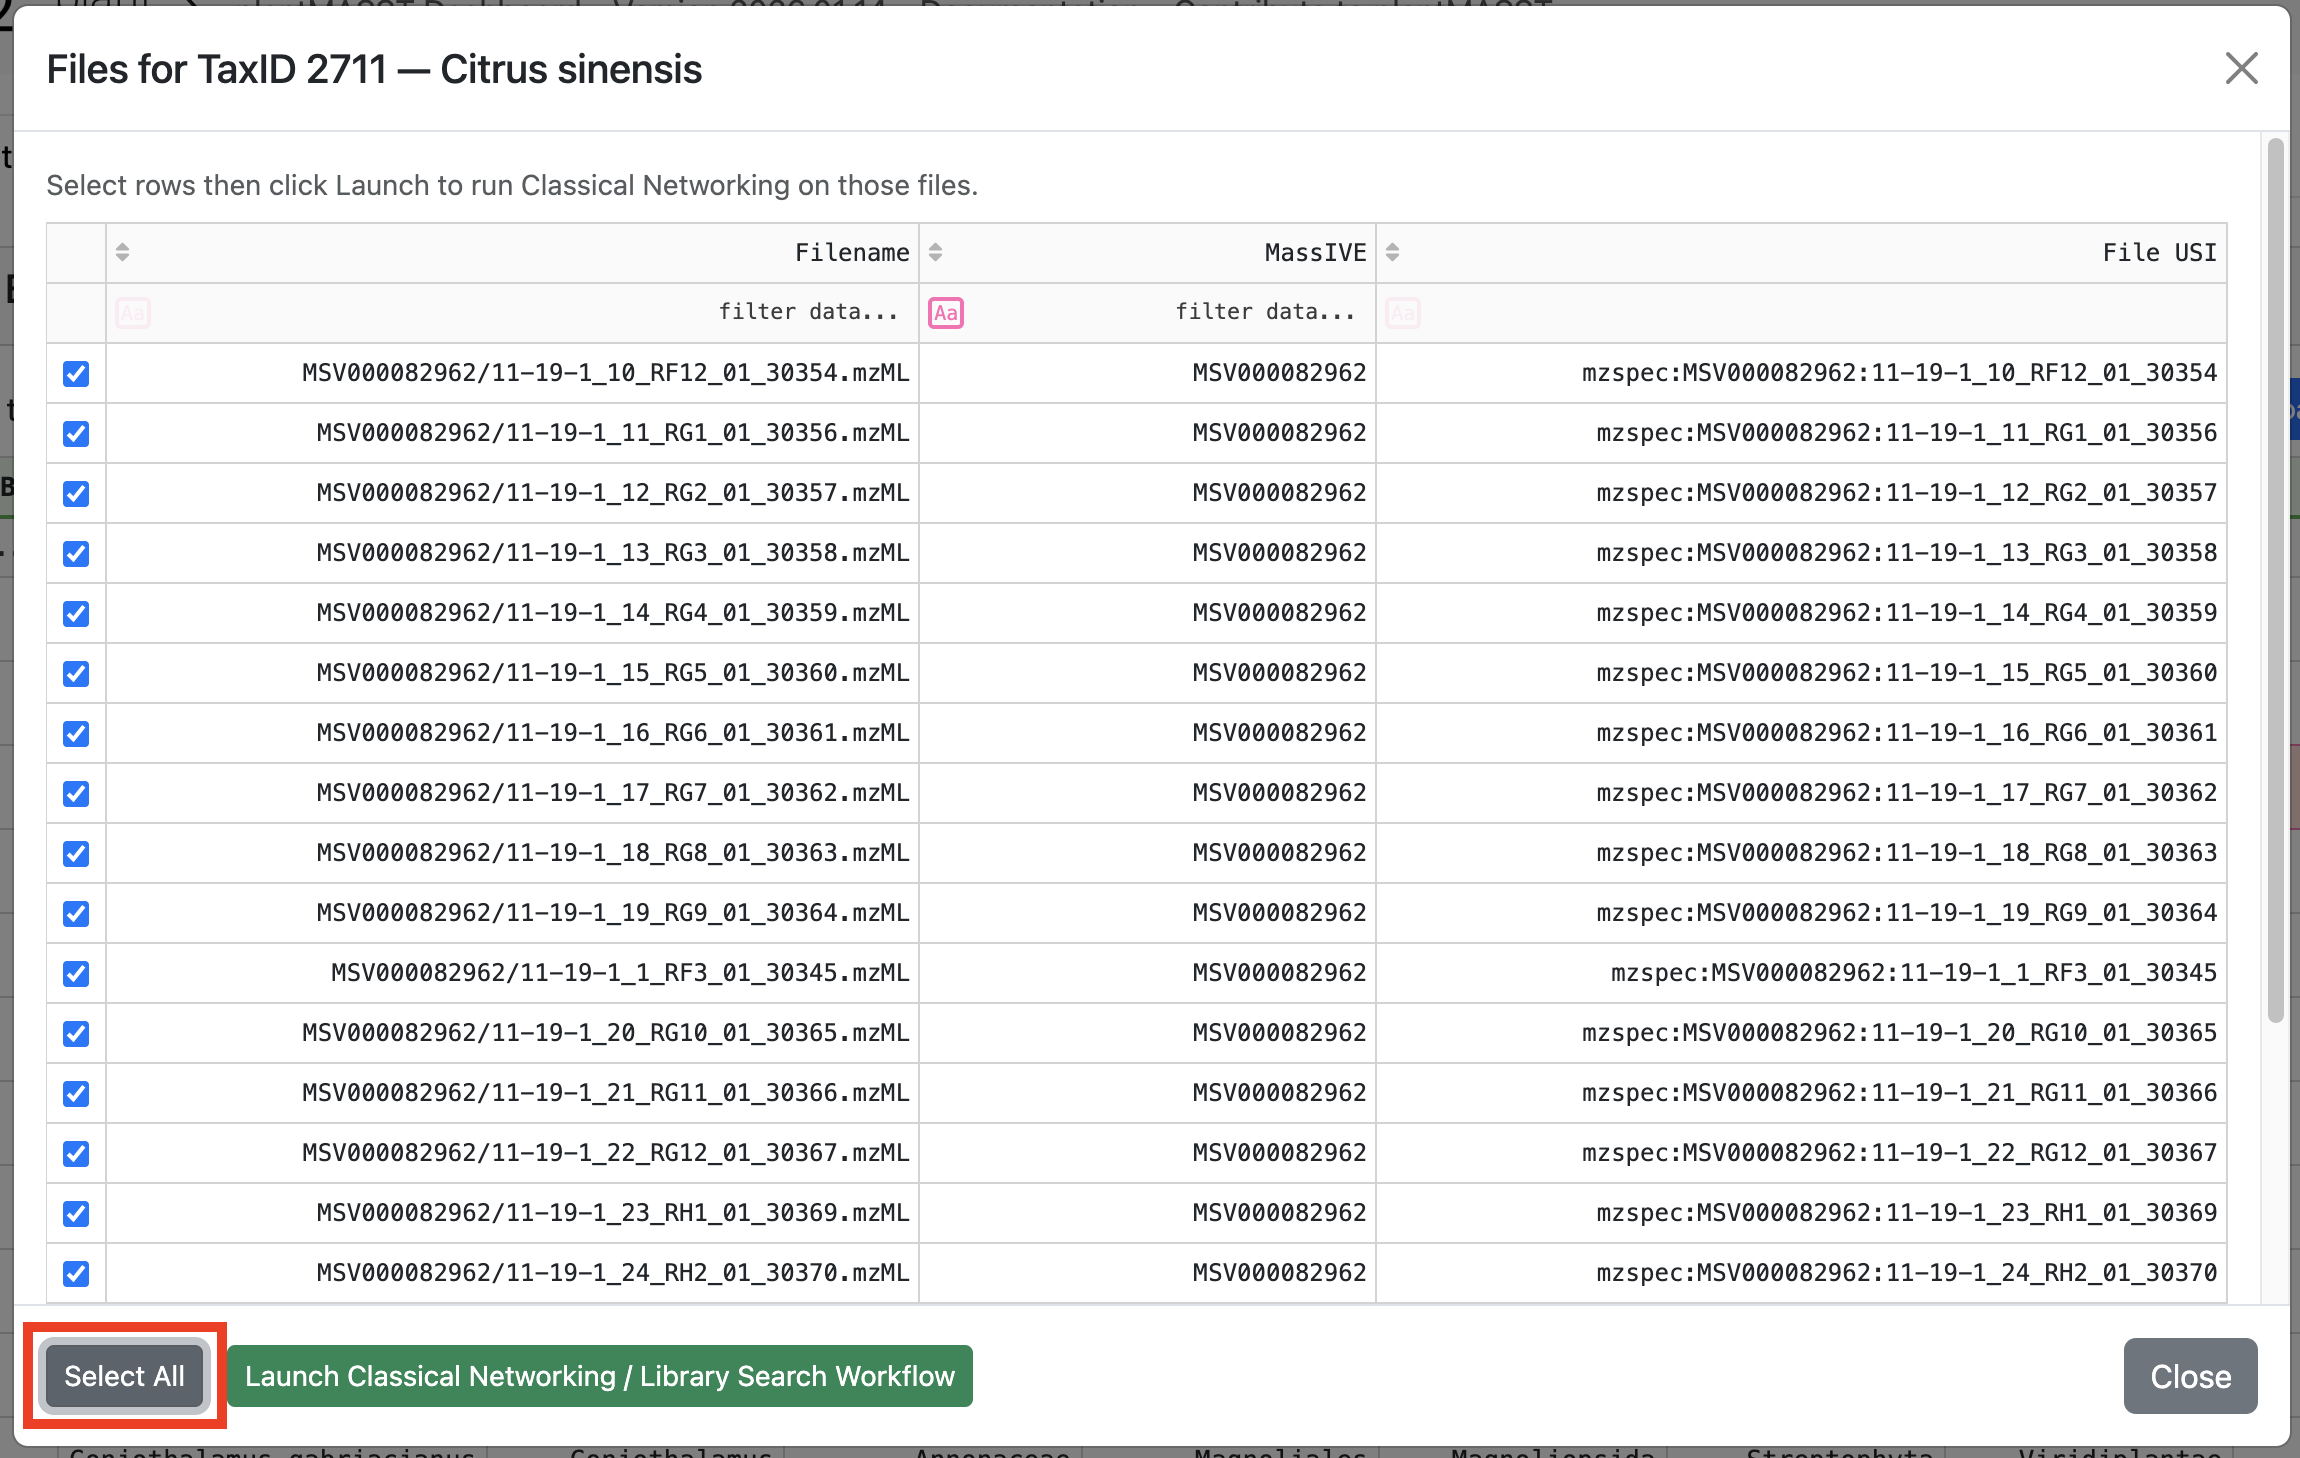 Figure 7. The modal with all rows selected after clicking "Select All".
Launching the workflow. Once at least one row is selected, the green Launch Classical Networking Workflow button becomes active. Clicking it opens the GNPS2 Classical Networking workflow in a new browser tab, with all selected file USIs pre-loaded as input.
Closing the modal. Clicking the Close button or the × in the top-right corner of the modal dismisses it and returns to the Explorer table. The selection is cleared automatically when the modal closes.
Explorer tips
- Filter before selecting: if a taxon has hundreds of files, use the filter box inside the modal (e.g. filter by MassIVE dataset) to narrow down before selecting and launching networking.
- Multiple datasets: files from different MassIVE datasets can be selected together in a single networking job — GNPS2 will handle them as one combined input.
Searching
The user can provide two different types of input for the search: by USI (Universal Spectrum Identifier) or by a list of Spectrum Peaks.
USI input
To perform a search using a spectrum identifier (USI), just copy and paste it into the “Spectrum USI” input area. If the user wants to perform a search using their own data, they can deposit datasets in MassIVE, MetaboLights, or Metabolomics Workbench, and using the GNPS Dashboard tool, get the USI assigned to each specific scan. The user can access the documentation to see more details about the usage of the dashboard (GNPS Dashboard Documentation).
In addition, a USI can be retrieved from a GNPS job (such as feature-based molecular networking or classical molecular networking workflow) or from any spectrum that is part of the GNPS libraries. Examples of types of valid USIs can be found in the Metabolomics Spectrum Resolver webpage.
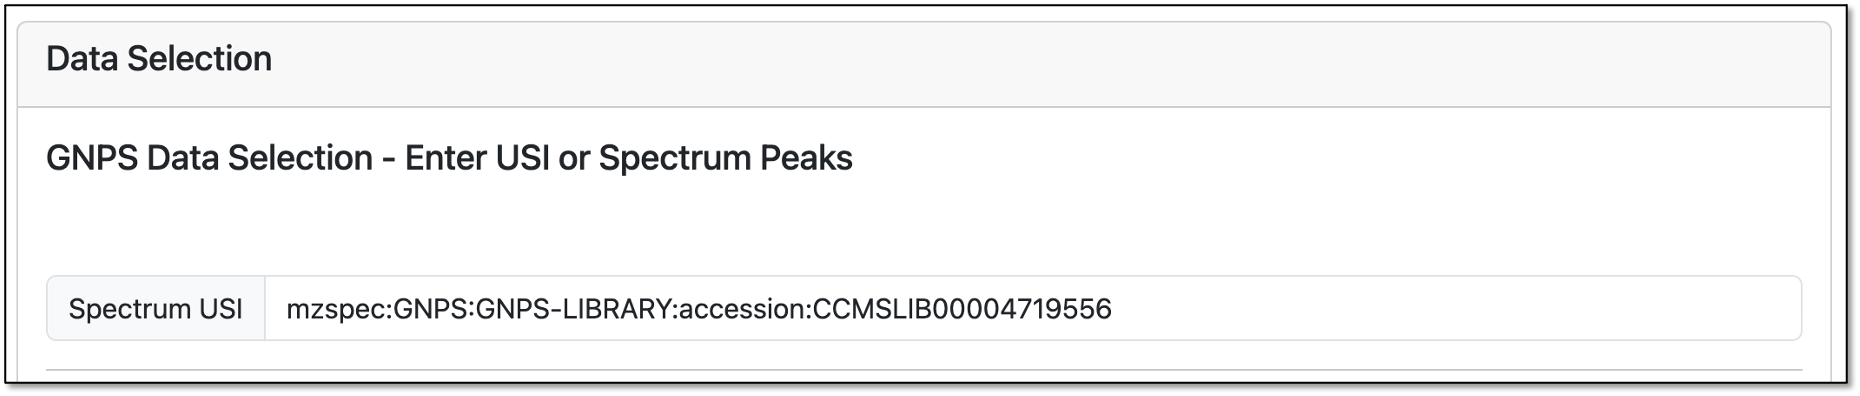 Figure 8. Input area for USI search on plantMASST
Spectrum Peaks input
Another useful way to perform a search is to use the "Spectrum Peaks" input field to pass the spectrum details as a list of m/z and intensity pair values. This option is particularly helpful when the spectrum is not deposited in any of the repositories cited above, so no USI is associated with it.
In such cases, the user must also provide a value in the “Precursor m/z” field to specify the mass-to-charge ratio of the precursor ion. The “Charge” field can be included as well, but it defaults to 1 if left blank. The "Use only the top N most intense peaks" is optional, and can be used both with USI and Spectrum peaks search. See more details about this parameter below.
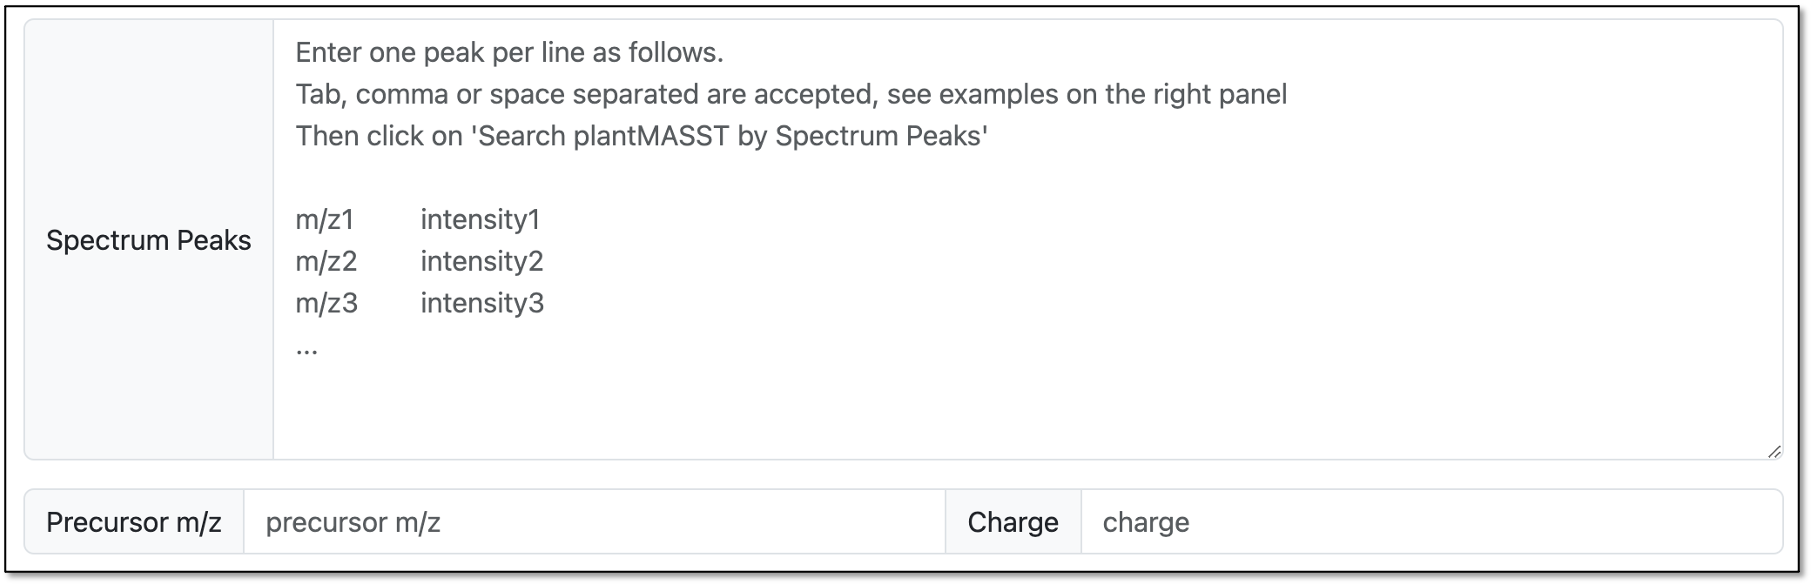 Figure 9. Input area for searching by spectrum peaks. The user needs to provide the formatted peak list and Precursor m/z. The charge input is optional, and defaults to 1 if not provided.
Input search parameters
The user can also adjust the search parameters to customize the search. The following parameters are available.
Parameters available only for searches using Spectrum peaks:
- Precursor m/z: The mass-to-charge ratio of the precursor ion. This field is required when using the Spectrum Peaks input.
- Charge: The charge state of the precursor ion. This field is optional and defaults to 1 if not provided.
Parameters available for both USI and Spectrum Peaks searches:
- Precursor m/z Tolerance (Da): The mass tolerance for the precursor ion. The default value is 0.05 Da.
- Fragment Tolerance (Da): The mass tolerance for the fragment ions. The default value is 0.05 Da.
- Cosine Threshold: The minimum cosine similarity score for a match. The default value is 0.7.
- Minimum Matched Peaks: The minimum number of matched peaks required for a match. The default value is 3.
- Use only the top N most intense peaks (optional): The user can specify a number to limit the number of peaks used in the search. This is useful for reducing noise in the spectrum by using only the N most intense peaks in the spectrum. The default value is empty, meaning all peaks will be used. When performing searches using USI, the list of peaks will be fetched from the GNPS database, and the user can choose to limit the number of peaks used in the search.
Important note
When using Use only the top N most intense peaks option with the USI search, it won't be possible to see mirror plots for the matches. This is because the search will be performed using the top N peaks, and the mirror plot requires the full spectrum and USI search for comparison. If you want to see mirror plots, please do not use this option.
Parameters available when performing Analog Search:
- Analog Search: This option allows the user to search for possible analogs of the compound. The default value is No.
- Delta Mass Above (Da): The maximum mass difference between the query and the analog. The default value is 130 Da.
- Delta Mass Below (Da): The minimum mass difference between the query and the analog. The default value is 200 Da.
Search examples
The example card on the right dashboard provides links to pre-configured search inputs. These examples demonstrate how to use the interface with both USI and spectrum peaks.
Clicking the links will populate the required field on the interface, requiring the user to only click “Search plantMASST by USI” or “Search plantMASST by Spectrum Peaks”, depending on the initial choice, as seen in the figure below. We encourage the user to explore the different searches and how the different parameters affect the search results to better understand how to use the interface.
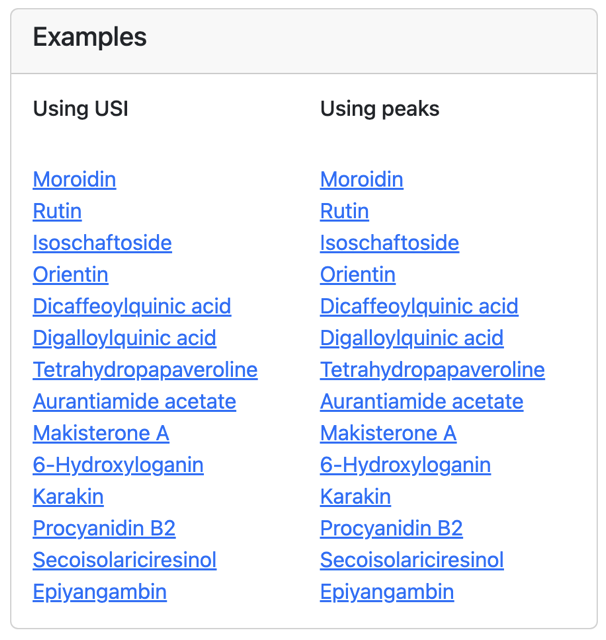
Figure 10. The example card provides a few pre-configured entries that can be used to explore how to populate the search parameters.
Performing plantMASST searches
plantMASST Search
The example below illustrates a search using an USI for the compound moroidin as input (Box 1). The fields marked with an “X” were not altered, and by default, the search will look only for exact matches within the specified parameters (Analog Search \= No, Box 2).
The remaining fields (Fragment Tolerance, Cosine Threshold, Minimum Matched Peaks, Delta Mass Below/Above) can be adjusted as necessary.
Finally, the user can click "Search plantMASST by USI" (Box 3) to perform the search.
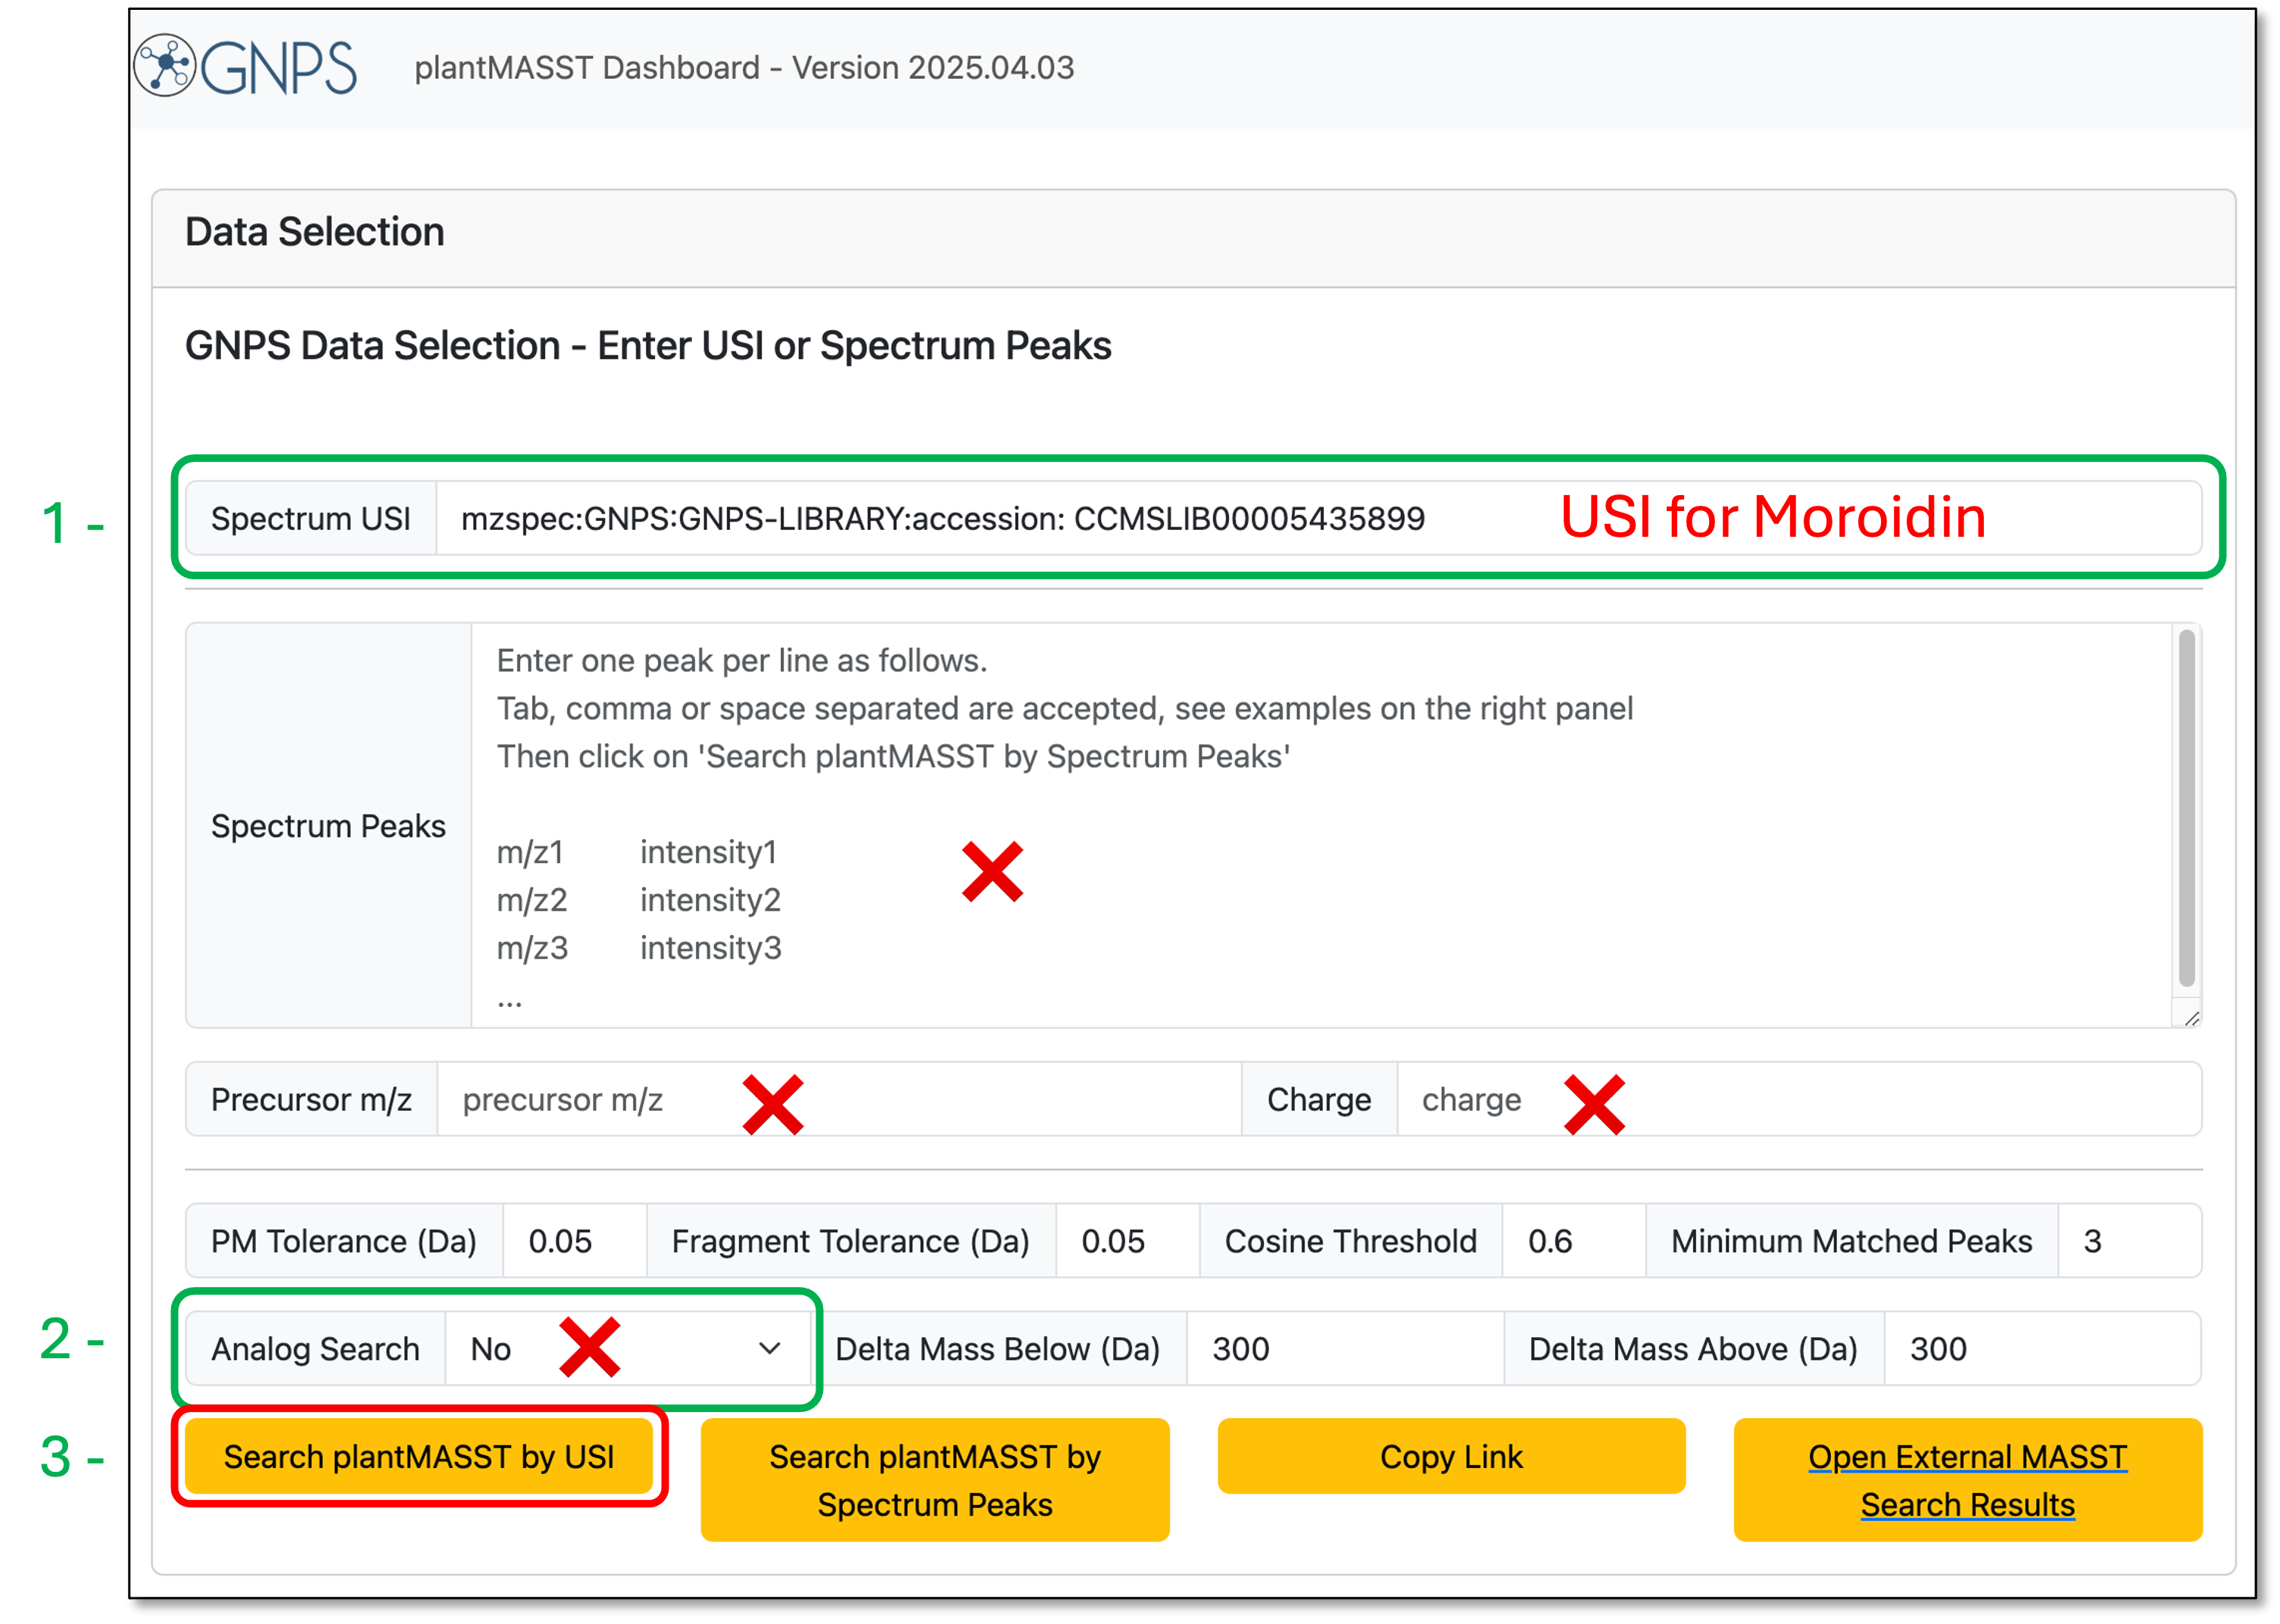 Figure 11. Search parameters populated for USI search for the compound moroidin. By default, the Analog Search is off, and the search will look for matches within the tolerance input for PM Tolerance and fragment tolerance. Box 1 - USI input for moroidin. Box 2 - Parameters set with Analog Search off (default). Box 3 - Search button to perform the search using the provided USI.
Another very useful feature available is the “Copy Link” button, which allows the user to share their search parameters easily. This facilitates reproducibility and collaboration by enabling others to rerun the exact same query.
URL example
The URL below is an example of the parameters used in the search shown in the figure above. The user can click on it to populate the search fields with the same parameters.
Click here to populate the plantMASST search with the parameters shown above
Reproducibility tip
Sharing a link like this ensures anyone can load the exact same parameters in the interface without manually re-entering them.
plantMASST Analog Search
To search for possible compound analogs, the user must select Yes on the “Analog Search” field. In that case, a delta mass range should also be given using the “Delta Mass Below (Da)”/”Delta Mass Above (Da)” inputs. Both USI and Spectrum Peaks search inputs can be used for an analog search.
In the figure below, we illustrate the search using the USI for moroidin (Fig 12, Box 1). The search parameters were defined as shown in Box 2. Finally, to perform the search, we click on ‘Search plantMASST by USI’ (Box 3).
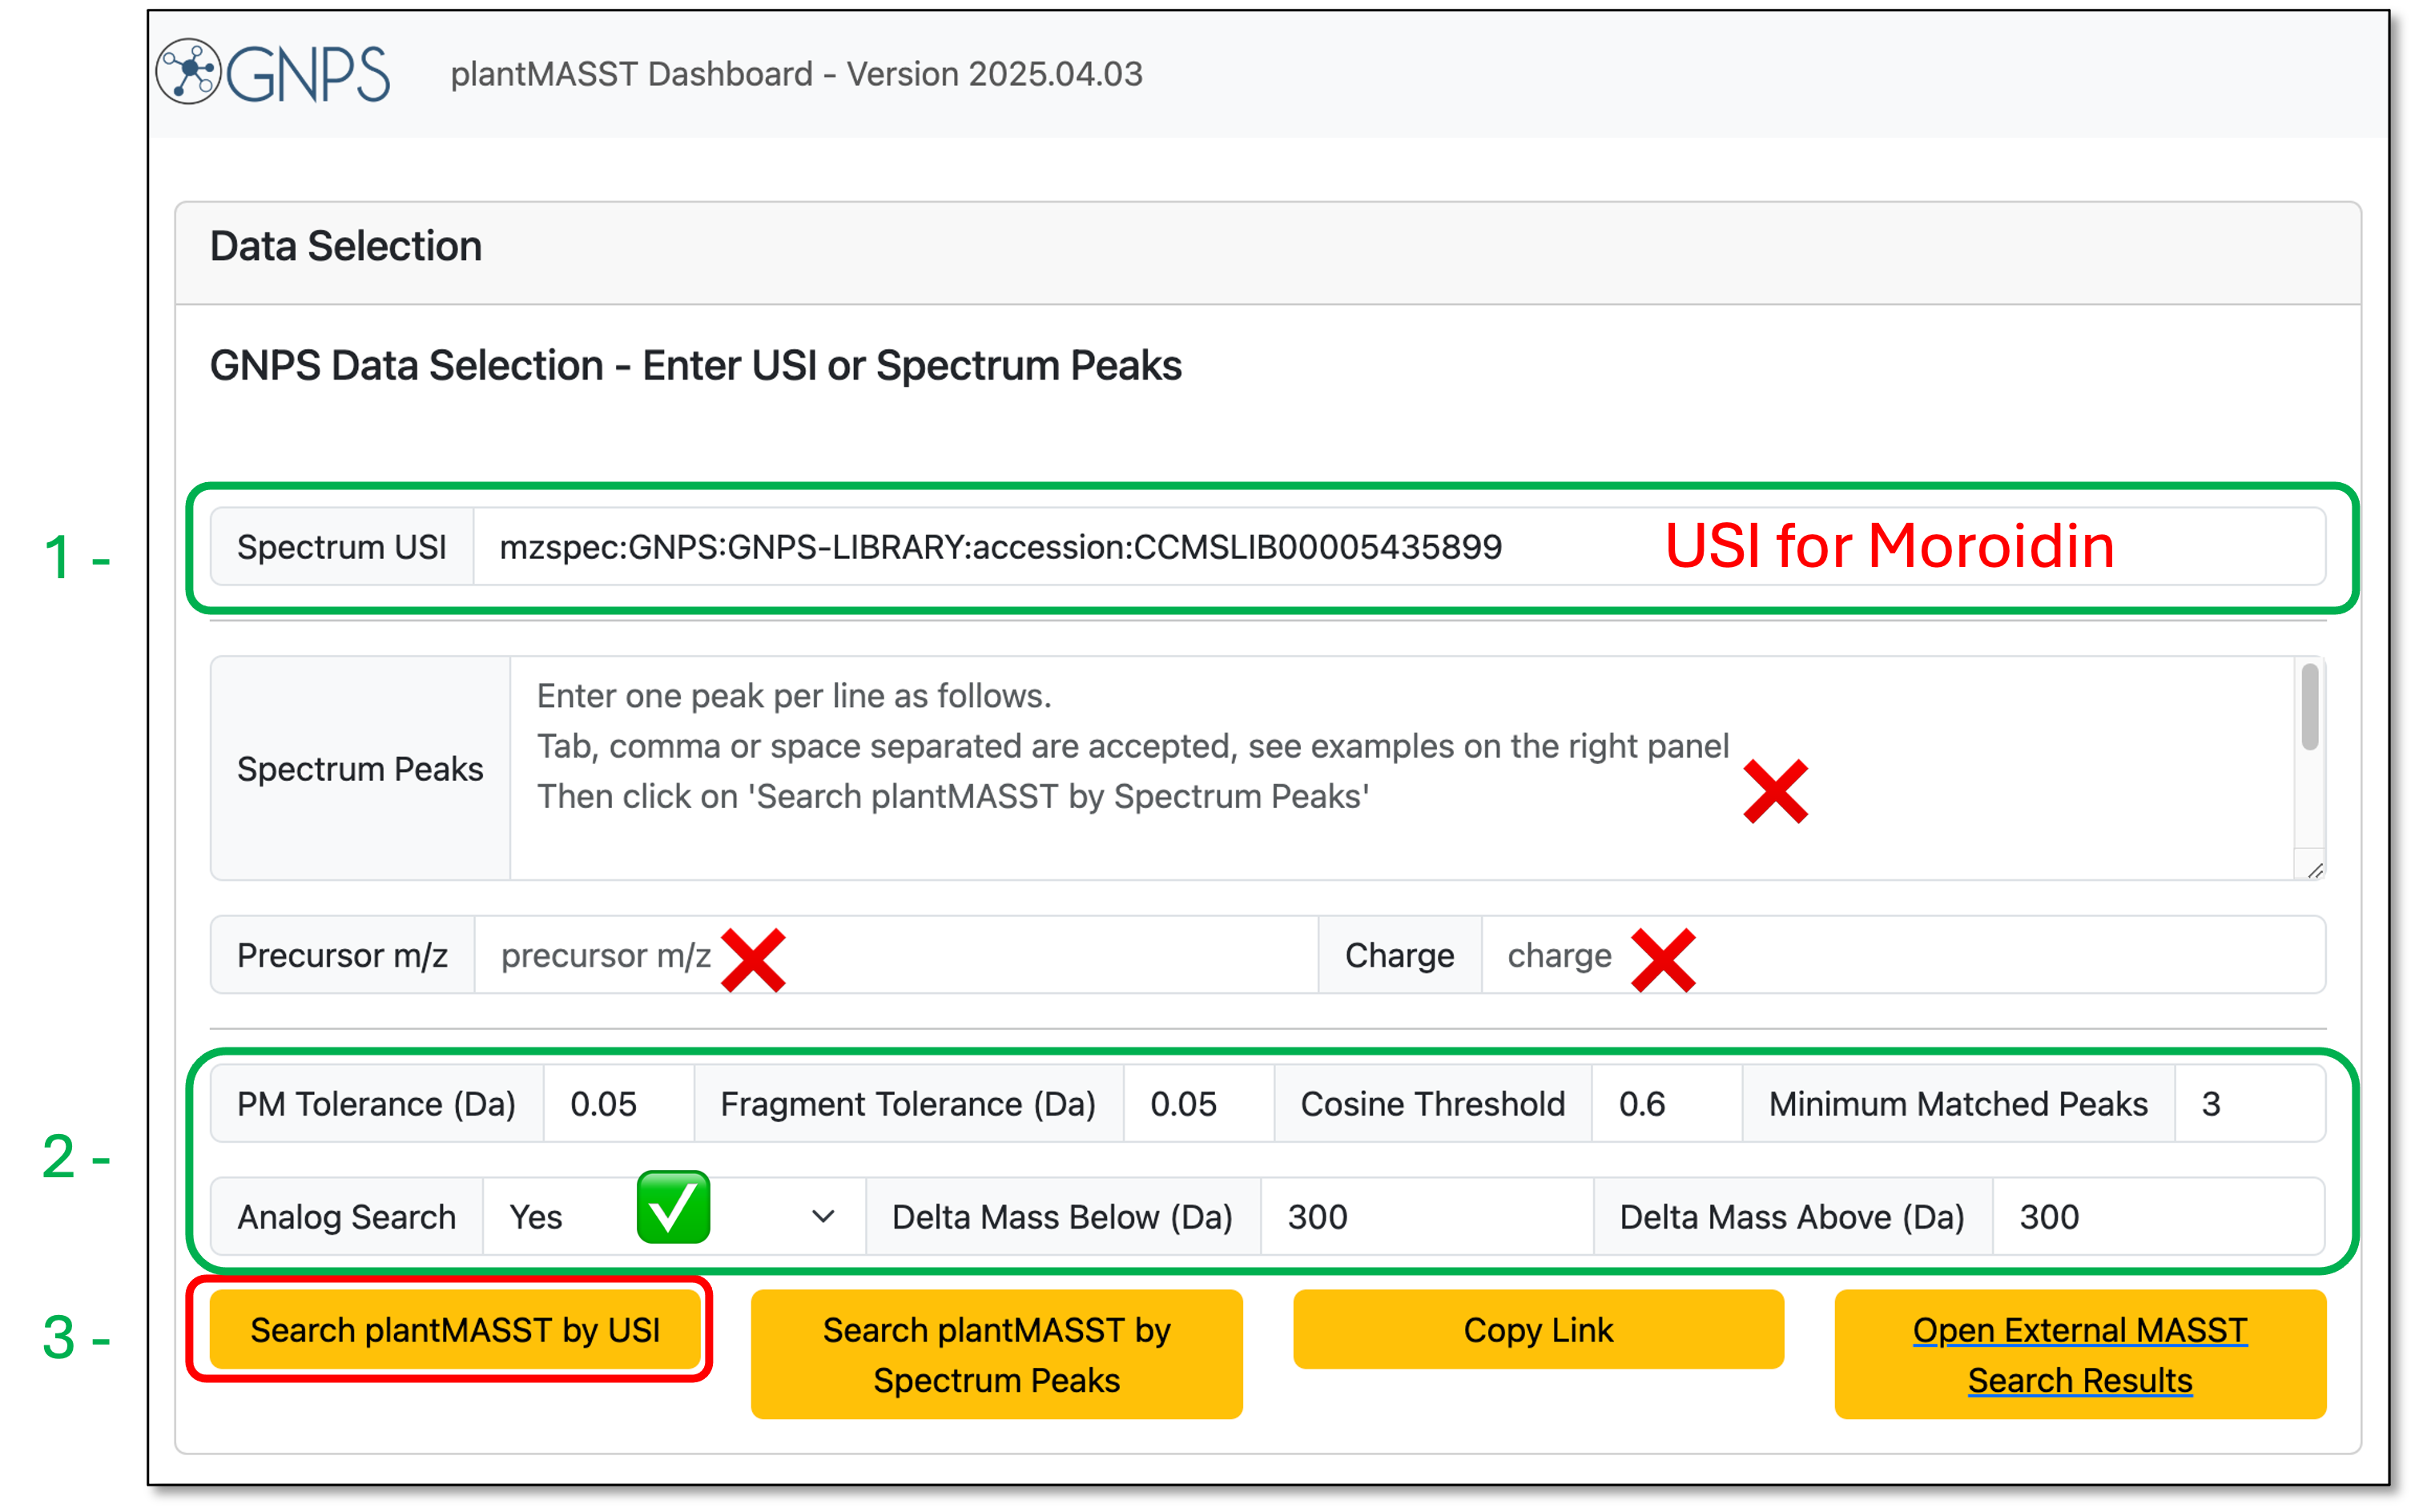 Figure 12. Search parameters set for Analog Search using an USI for the compound moroidin. Box 1 - USI input for moroidin. Box 2 - Parameters set with Analog Search on. Box 3 - Search button to perform the search using the provided USI.
Reproducibility tip
To populate the search fields as shown above, click the link: plantMASST analog search parameters example
Output
Default search results
The search results can be visualized in two main formats: A taxonomic tree and through data tables. Those outputs are highlighted in the figure below. The tree offers interactive features, and the user can explore the details by moving the cursor over any node, for example. The visualization is also highly customizable using the controls available above the tree.
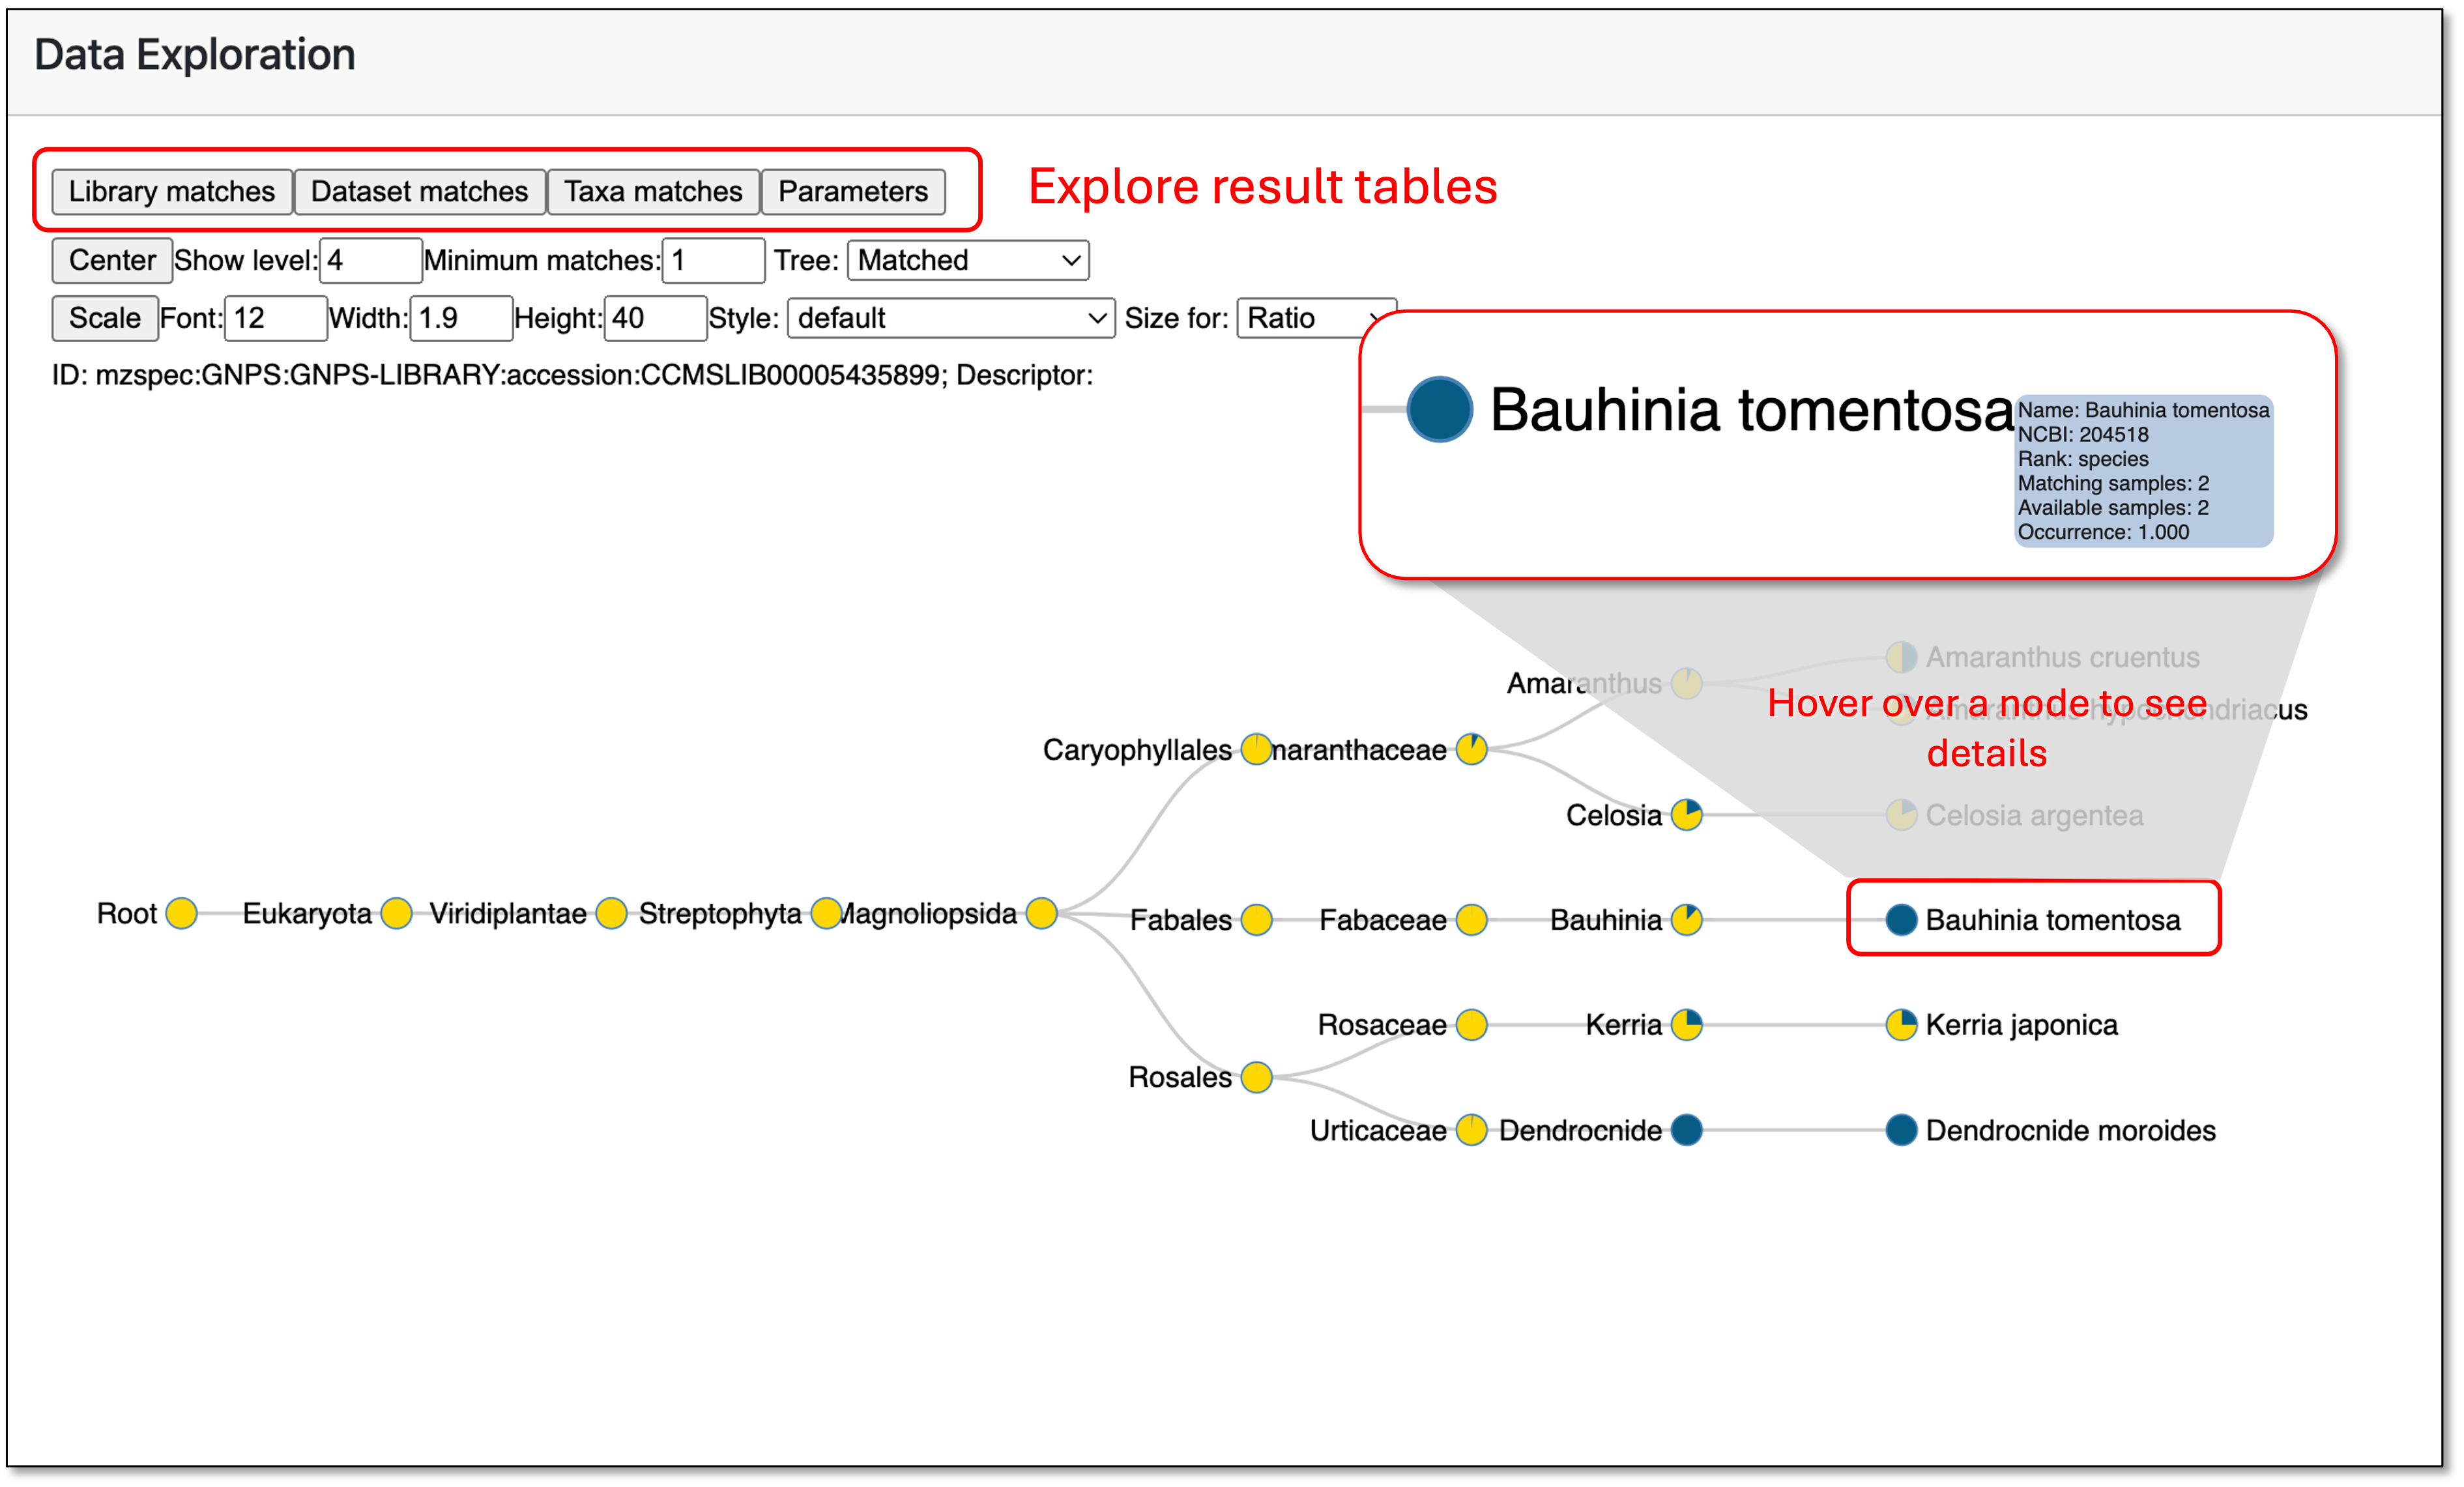 Figure 13. Interactive result tree visualization. The user can use the available controls to customize the visualization as well as see details by moving the mouse over the nodes. The result tables can be visualized and exported by clicking the buttons on the top left corner.
The results tables offer a concise way of obtaining more details about the matches. On the Dataset Matches tab, information such as NCBI taxonomy ID number, organism name, and external links to the matching spectrum, public dataset source, and a link to visualize the original file data using the GNPS Dashboard are available. For this search, 90 matches with public datasets were retrieved for moroidin.
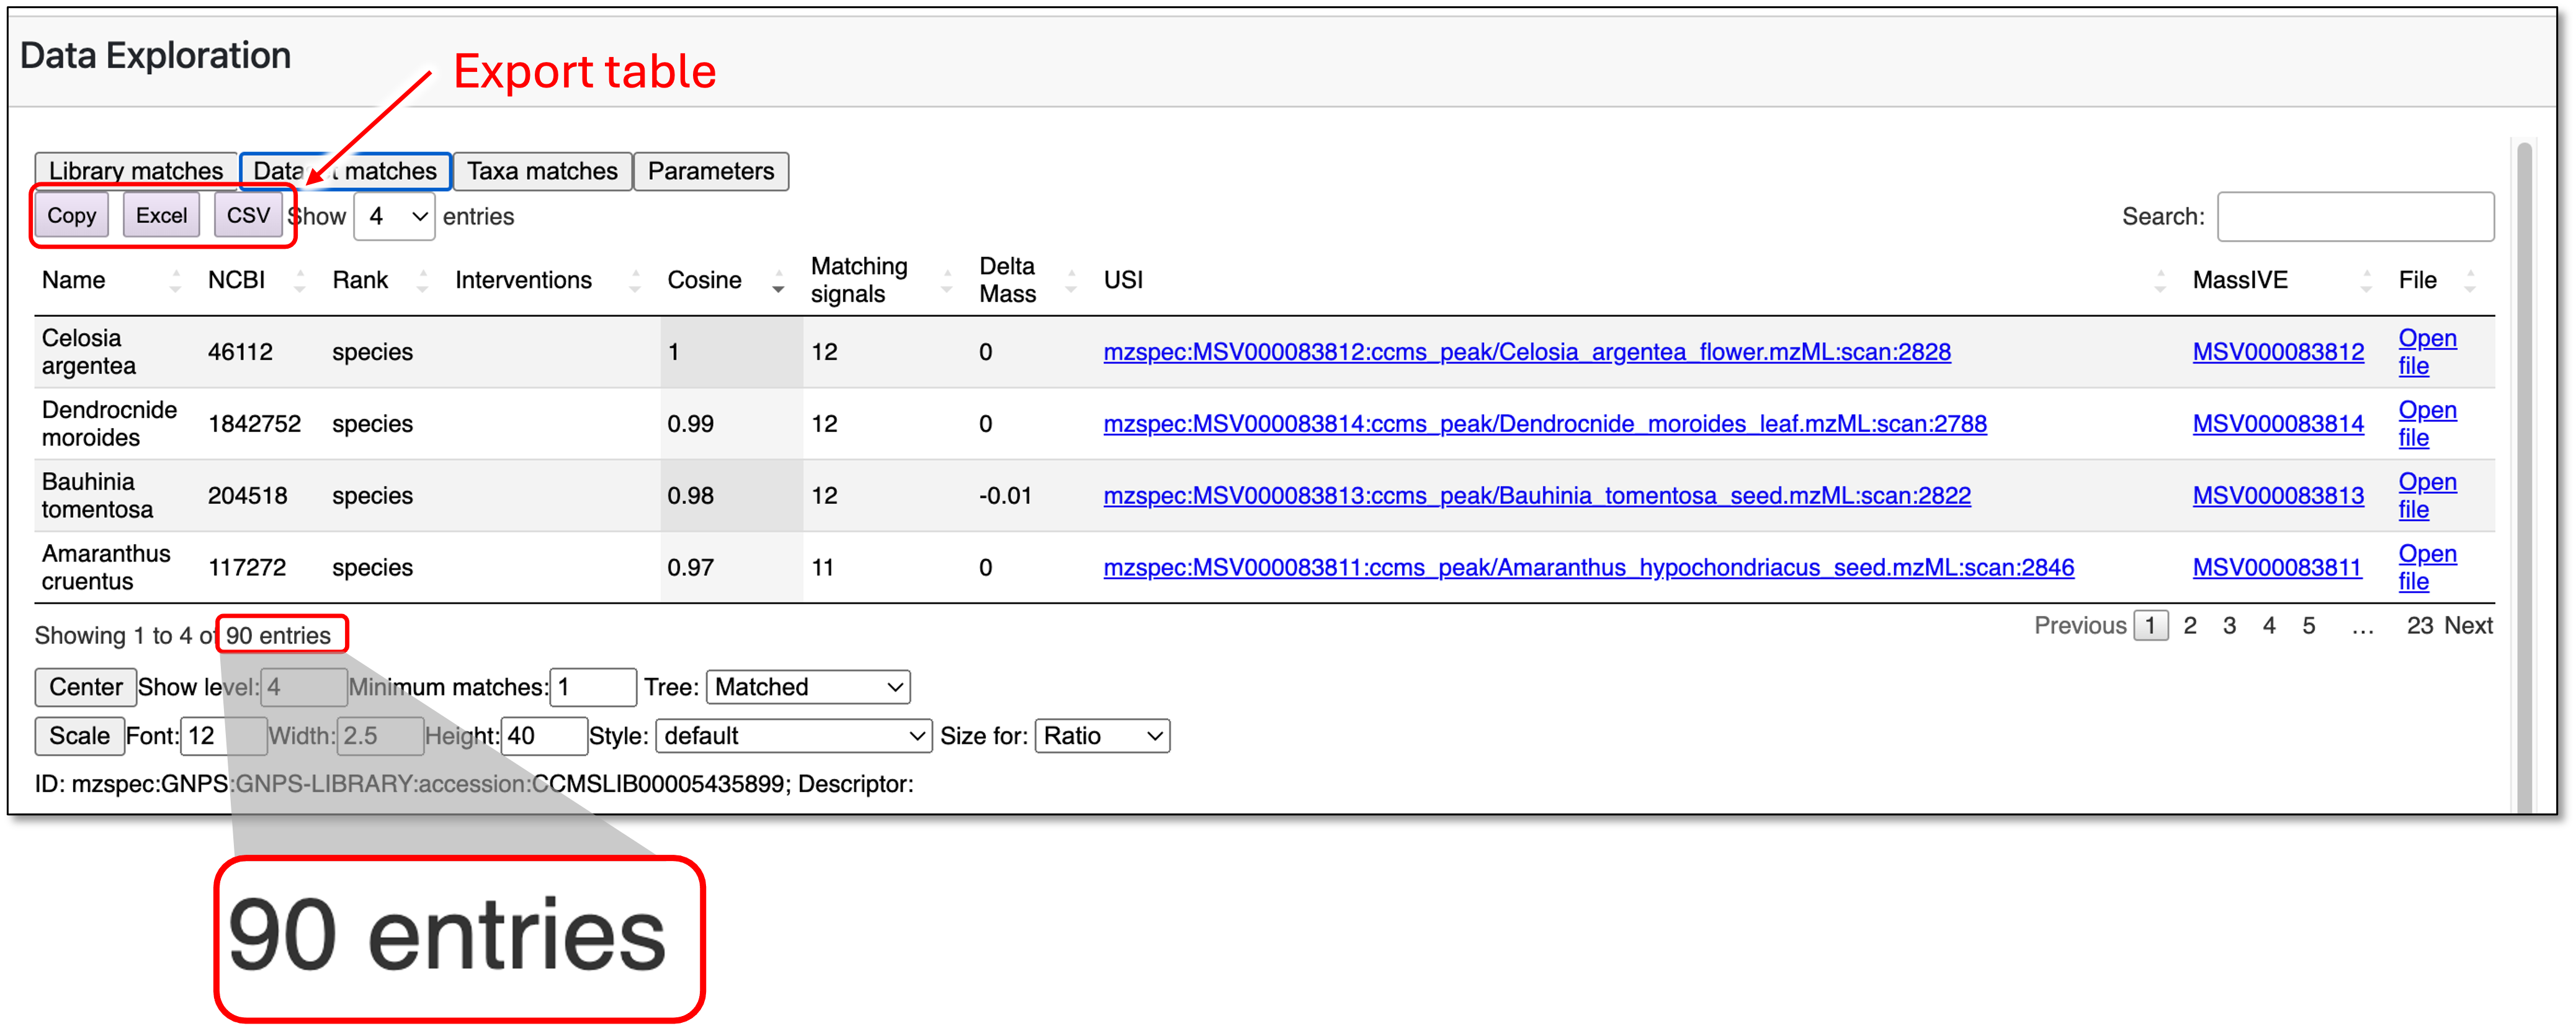 Figure 14. Dataset matches table visualization. Here details such as the NCBI taxonomy ID, cosine similarity, matching spectra USI and other information are summarized. The table can also be exported in 3 different formats to be further explored.
Analog search Results
Below, we can see the results retrieved when the analog search is performed with the parameters described in the "plantMASST Analog Search" section. The interface is the same as described for the standard search, including customizing the tree visualization and exporting table results, as seen in the figure.
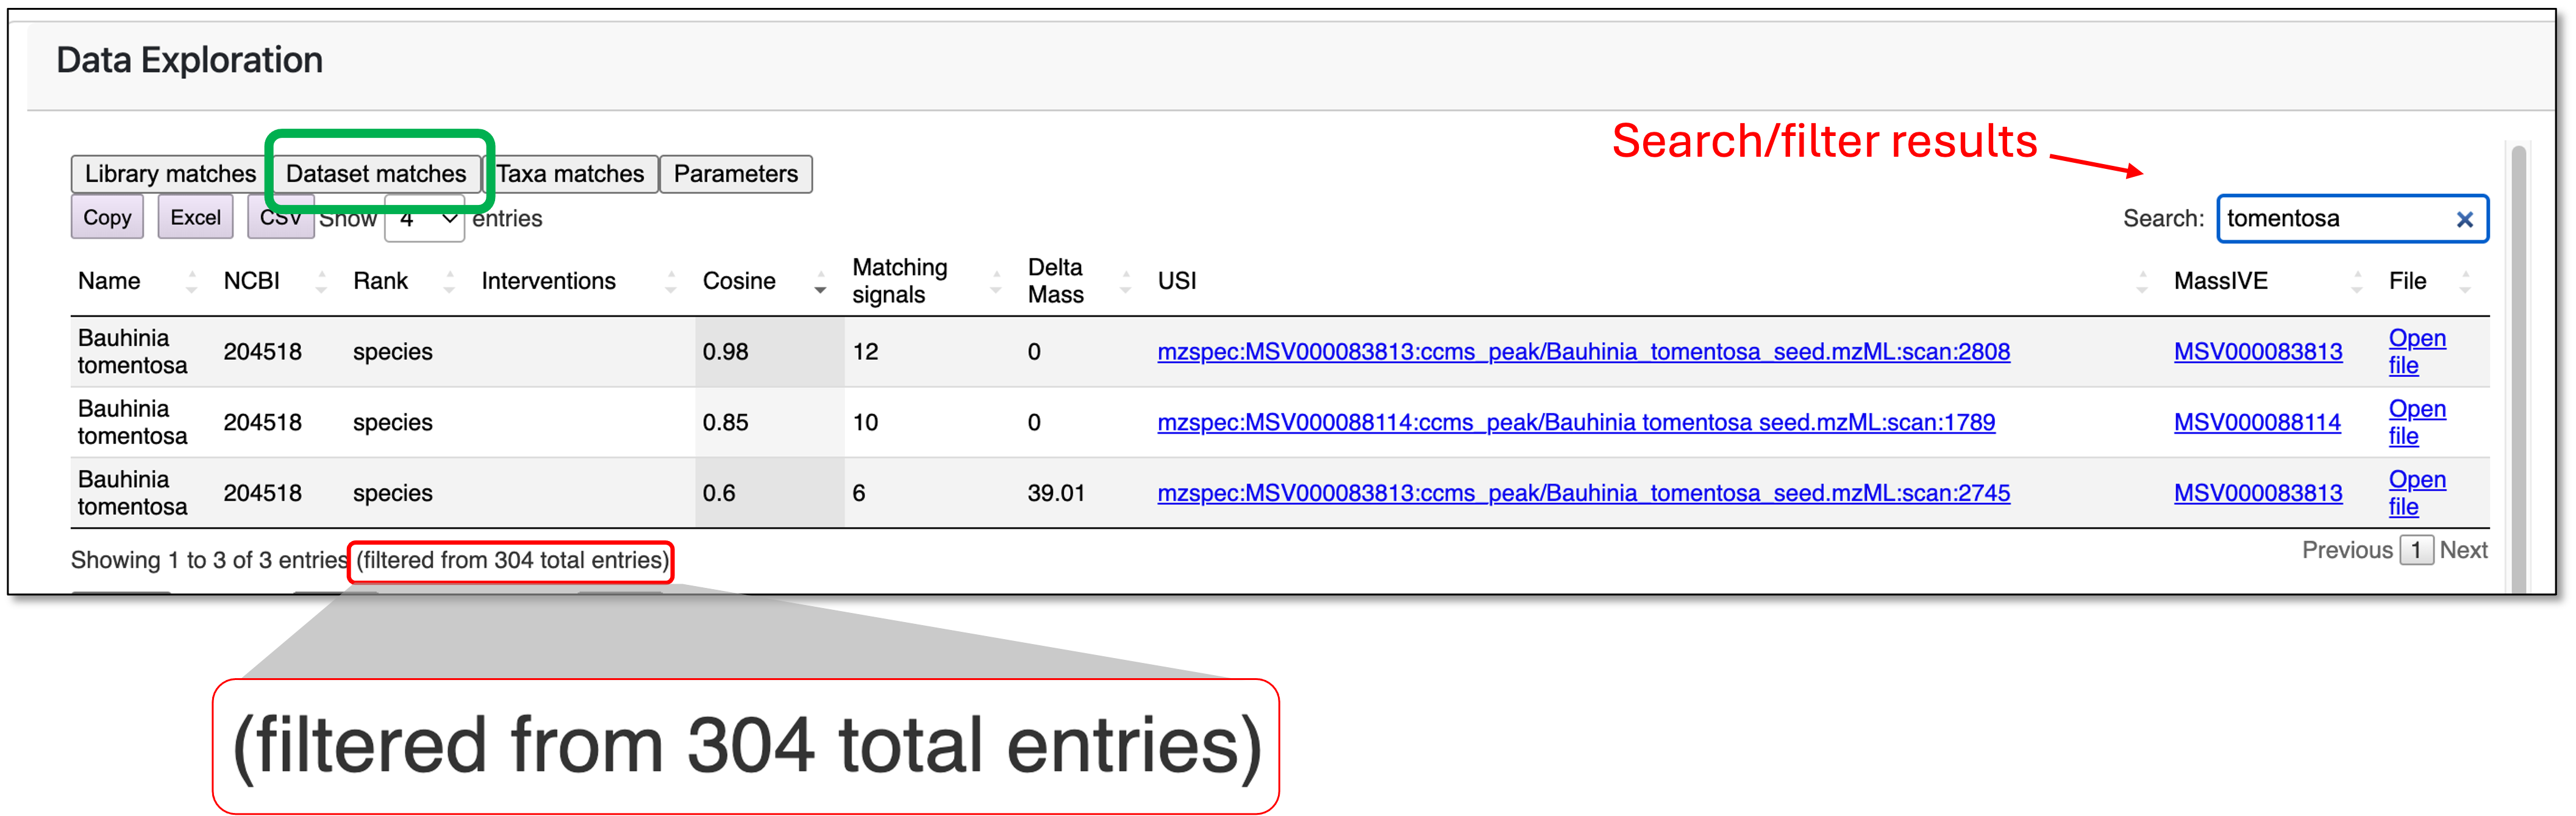 Figure 15. Dataset matches table, filtered to matches containing the word “tomentosa”. NCBI taxonomy ID, cosine similarity, matching spectra USI, and other information are available. The table can also be exported in 3 different formats to be further explored.
However, here we can see the total amount of matches has increased compared to the previous search. Since we are also looking for analogs, more matches are expected, and we can see that compounds that are not exact matches to moroidin are also retrieved.
The Delta Mass column in the table above shows one compound that has a Delta mass of +39.01 Da compared to moroidin. This means that the spectrum is similar enough to moroidin (according to the set parameters), but the precursor has a greater mass, suggesting that the compounds' core structure might be similar but with an additional portion corresponding to the observed delta mass.
Downloading results
As described in the previous session, the result tables can be exported in different formats for further use or processing. Besides that, the entire interactive tree with embedded tables can be downloaded as a HTML file, clicking on “Download Results” at the bottom of the page.
Contributing to plantMASST
In order to contribute MS/MS data to plantMASST you just need to:
1) upload your MS/MS data to MassIVE repository and
2) make sure to provide metadata in the form of a TSV file during deposition.
We will update plantMASST with the new information every 3 months. If you are depositing a big volume of data or want to contribute ASAP, you can contact us directly.
MassIVE Dataset
Add your MS/MS data files (in .mzML or .mzXML format) to the MassIVE repository. Please refer to this excellent YouTube tutorial by Dr. Daniel Petras on how to convert and upload your data. Additional information on how to deposit data to MassIVE can also be found here.
Existing dataset with .raw files deposited
If you already have your files deposited on MassIVE as .raw files, you can use the default conversion mechanism already implemented on MassIVE. To know more, click here: Raw Data Automated Conversion documentation
Mandatory dataset settings
Please make sure that your dataset is set to "public" and that you have included:
- "GNPS" as a prefix to the dataset name.
Dataset name example
GNPS - Jordan Plants - PA - Crude and Extracts
- The dataset attribute "DatasetType" is set to "Metabolomics"
Associated metadata file
Please make sure to include a TSV file with metadata associated with the deposited files. The minimum requirement is that the TSV contains the headers for filename, NCBI taxonomy ID, and the plant species.
If possible, follow the newest ReDU metadata format available here. If you want to know more about ReDU click here
Table example
| filename | NCBITaxonomy | species |
|---|---|---|
| 140419_psycb1-2_100x_RB5_01_18146.mzXML | 3046967 | Palicourea brachiata |
| C18p_FRM3_5ul_BE8_01_7604.mzXML | 4113 | Solanum tuberosum |
| MSV000079628/20160321-JWGZ13-3_P2-F-8_01_33869.mzXML | 4442 | Camellia sinensis |
What is already deposited in plantMASST?
To see a list of species to which we have MS2 data already included on plantMASST you can download this TSV file. Alternatively, the PlantMASST Explorer tab offers a live, browsable view of every taxon currently in the database, along with its file count.
Page Contributors