IsoPairFinder
IsoPairFinder is a computational tool that identifies pathway intermediates by analyzing paired unlabeled (12C) and isotope-labeled (13C) metabolomics data from gene-edited microbes. By prioritizing substrate-specific feature pairs, IsoPairFinder dramatically reduces the chemical search space to enable efficient identification of biologically relevant intermediates.
- GNPS2 workflow - You can run IsoPairFinder in GNPS2 - here.
- R package - The R package and source code is available on GitHub.
- Demo data - The demo data can be downloaded here.
- Tutorials - Comprehensive documentation is available here.
If you used IsoPairFinder in your research, please cite the following paper: - Z. Zhou, Y. Liu, M. W, D. Dodd*, IsoPairFinder: A tool for biochemical pathway discovery using stable isotope tracing metabolomics, Submitted, 2025. bioRxiv.
Input data
We will require the following files:
- Feature tables (comma-separated CSV files; unlabeled WT vs. unlabeled mutant and labeled WT vs. labeled mutant) contain differential feature results exported from common peak picking tools (XCMS, MSDIAL, MZmine, etc.). The protocols for data preparation of these tools are detailed in the tutorials.
- Sample Information Table (CSV file) defines the tracers and group information
- Raw data files (mzML/mzXML files) are the LC-MS data files for each sample.
- MS/MS files (mzML/mzXML/mgf format) are the MS/MS data files.
Feature Table
- peak_table_C12.csv: the peak area table of the unlabeled group.
- The first 4 columns should be “id”, “mz”, “rt”, “ms1_isotopes”, and other columns are sample names.
- peak_table_C13.csv: the peak area table of the labeled group.
- The first 4 columns should be “id”, “mz”, “rt”, “ms1_isotopes”, and other columns are sample names.
id,mz,rt,ms1_isotopes,hyuA_UA_1,hyuA_UA_2,hyuA_UA_3,WT_UA_1,WT_UA_2,WT_UA_3
43.0178@4.943,43.0178,4.943,43.01777:11184 44.02112:0 45.02448:6848,30667,30948,30120,28344,27638,28581
45.0334@4.942,45.0334,4.942,45.03339:6695 46.03674:409 47.0401:0,19052,16036,18015,17337,16850,15274
55.0539@4.564,55.0539,4.564,55.05389:30018 56.05724:32499 57.0606:1593,87663,81496,84551,99256,82603,84896
Sample Info
- Column names: “sample_id”, “group”, “tracer_group”, and “type”.
- sample_id: The sample ID, which should match the column names in the feature table, and should be same as the raw data file name.
- group: Your wild type samples must be the group WT, and the mutant samples must be MUTANT.
- tracer_group: 12C or 13C.
- type: The type column defines the type of the sample, e.g., sample or control.
sample_id,group,tracer_group,type
WT_UA_1,WT,12C,sample
WT_UA_2,WT,12C,sample
WT_UA_3,WT,12C,sample
hyuA_UA_1,MUTANT,12C,sample
hyuA_UA_2,MUTANT,12C,sample
hyuA_UA_3,MUTANT,12C,sample
WT_13CUA_1,WT,13C,sample
WT_13CUA_2,WT,13C,sample
WT_13CUA_3,WT,13C,sample
hyuA_13CUA_1,MUTANT,13C,sample
hyuA_13CUA_2,MUTANT,13C,sample
hyuA_13CUA_3,MUTANT,13C,sample
Raw Data & MS/MS Data
- mzML/mzXML files: The raw data files for each sample. The names of the raw data files should match the sample IDs in the sample information table.
- MS/MS files: The MS/MS data files for each sample, which can be in mzML/mzXML/mgf format. The MS/MS data of Pooled samples are recommended.
GNPS2 Workflow
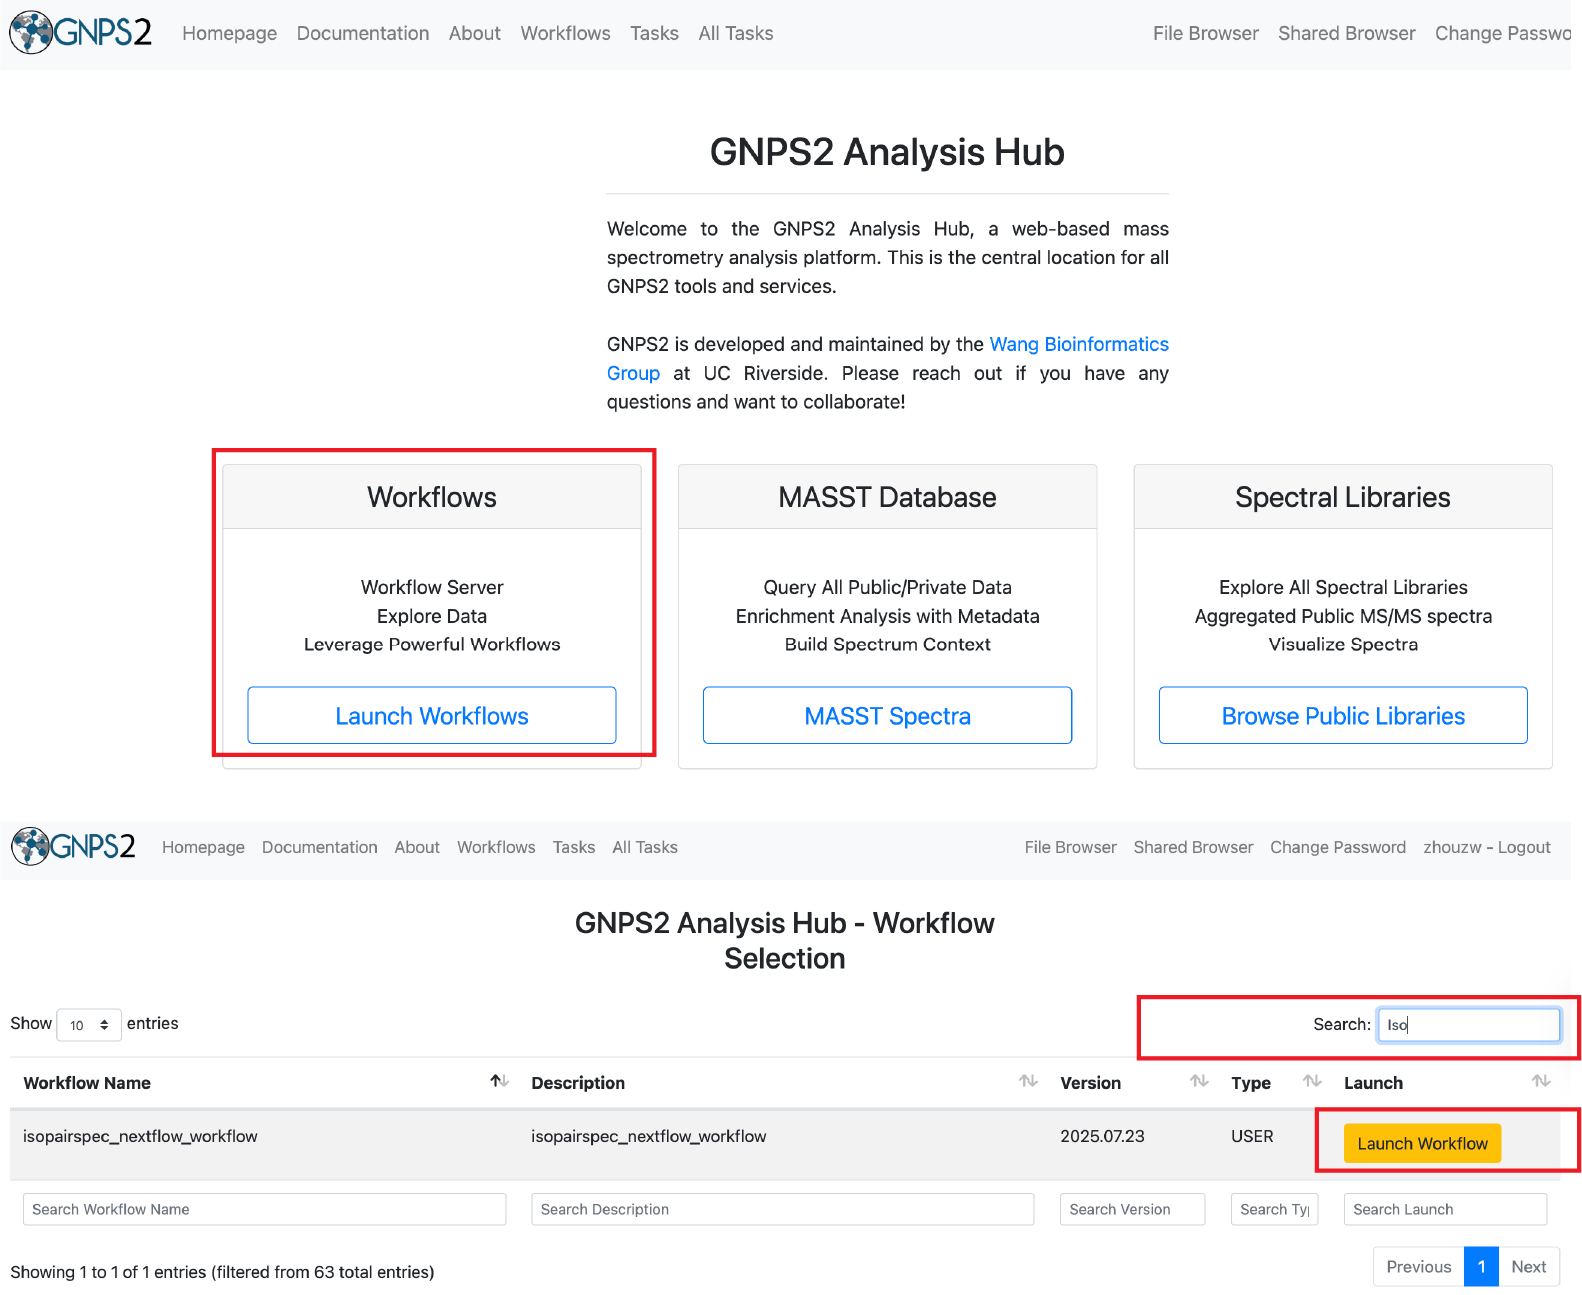
- Login to the GNPS2 platform and navigate to the IsoPairFinder workflow.
- Click on the "Launch Workflow" button to start a new workflow.
- Search for "IsoPairFinder" in the workflow list or use the direct link to the workflow.
- Upload the required input files (feature tables, sample information table, raw data files, and MS/MS files) to the GNPS2 platform.
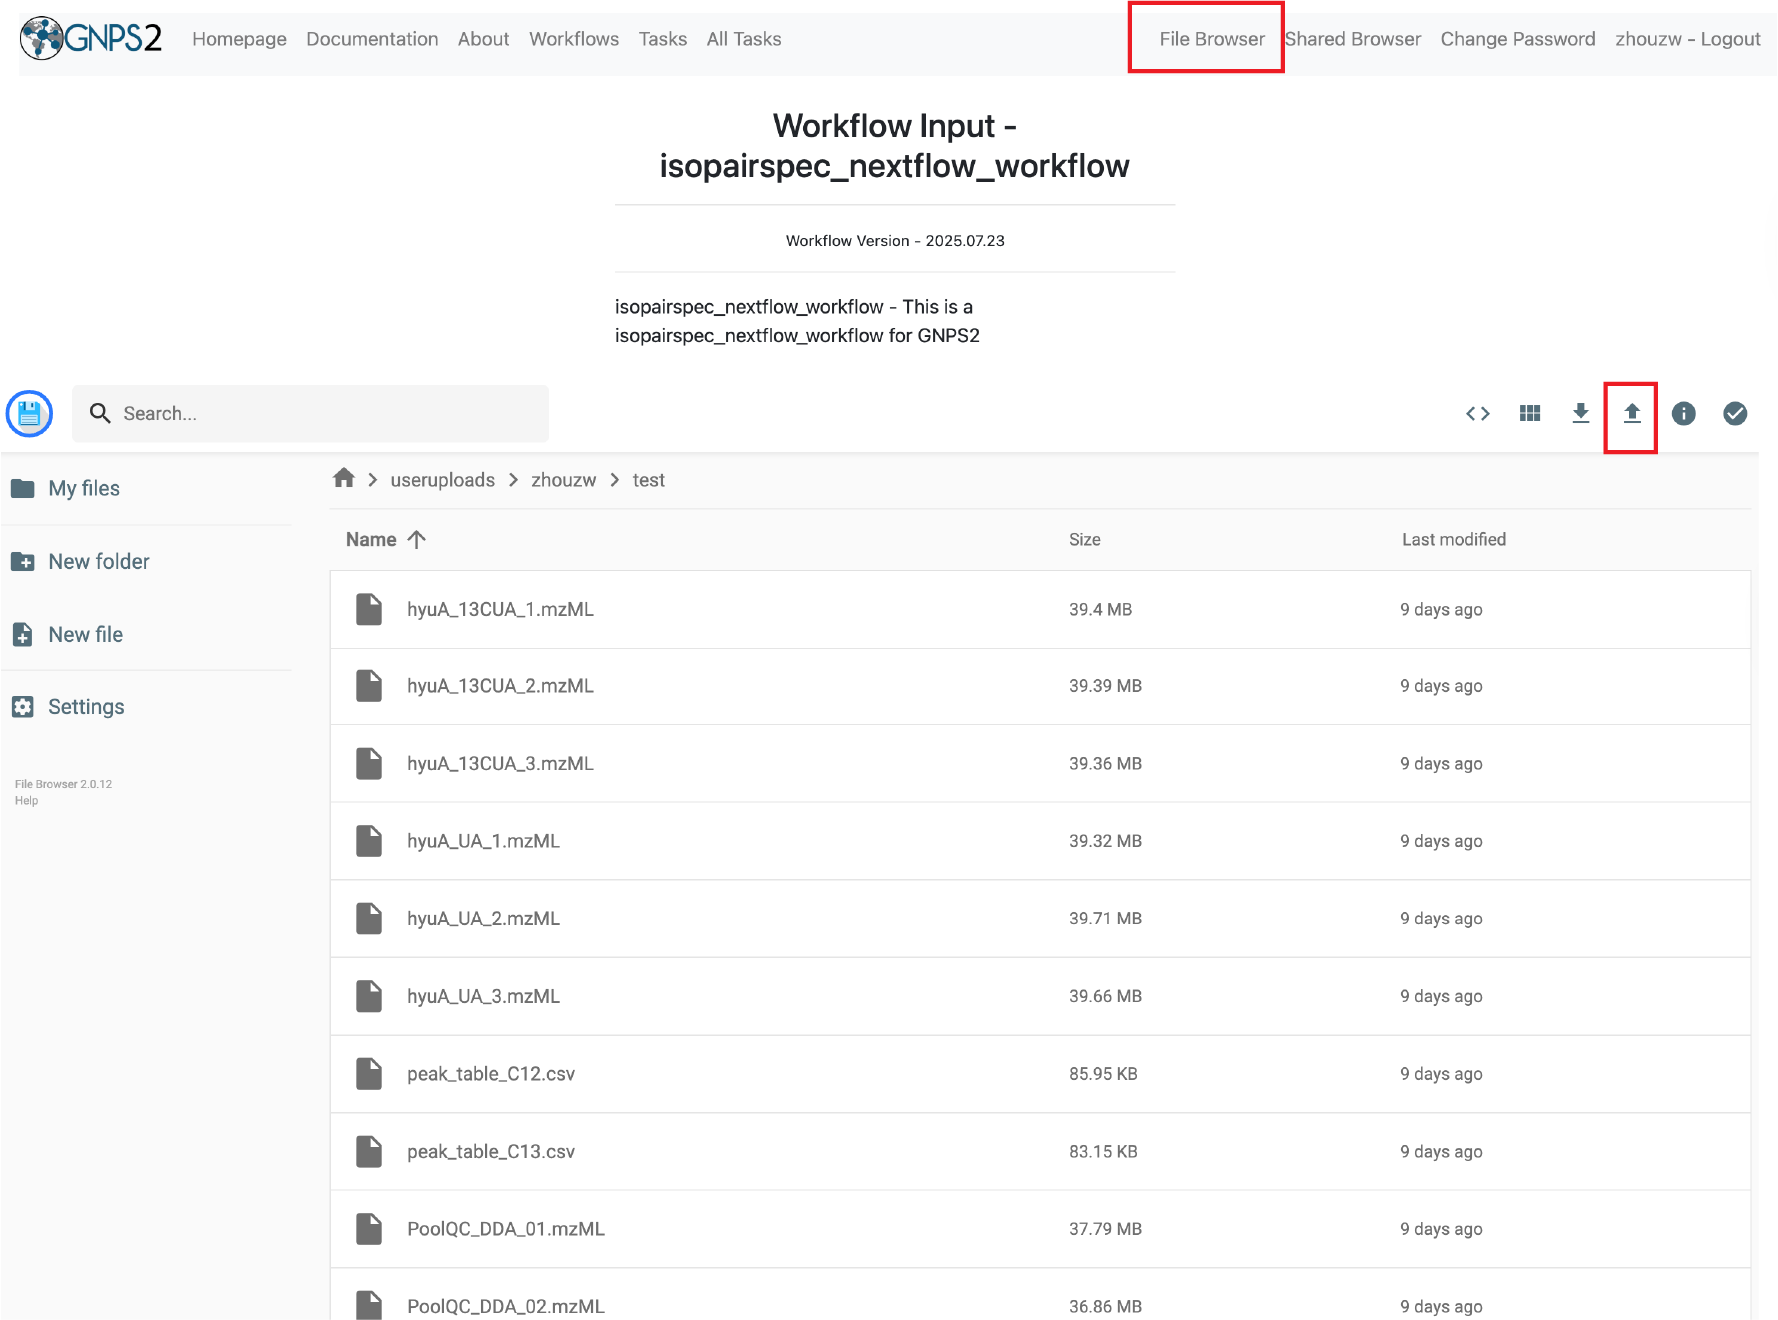
- Type the job name, and assign the uploaded files to the appropriate input fields in the workflow interface.
- Select the sample information table
- Select the feature tables for unlabeled and labeled groups.
- Select the raw data files.
- Select the MS/MS files.

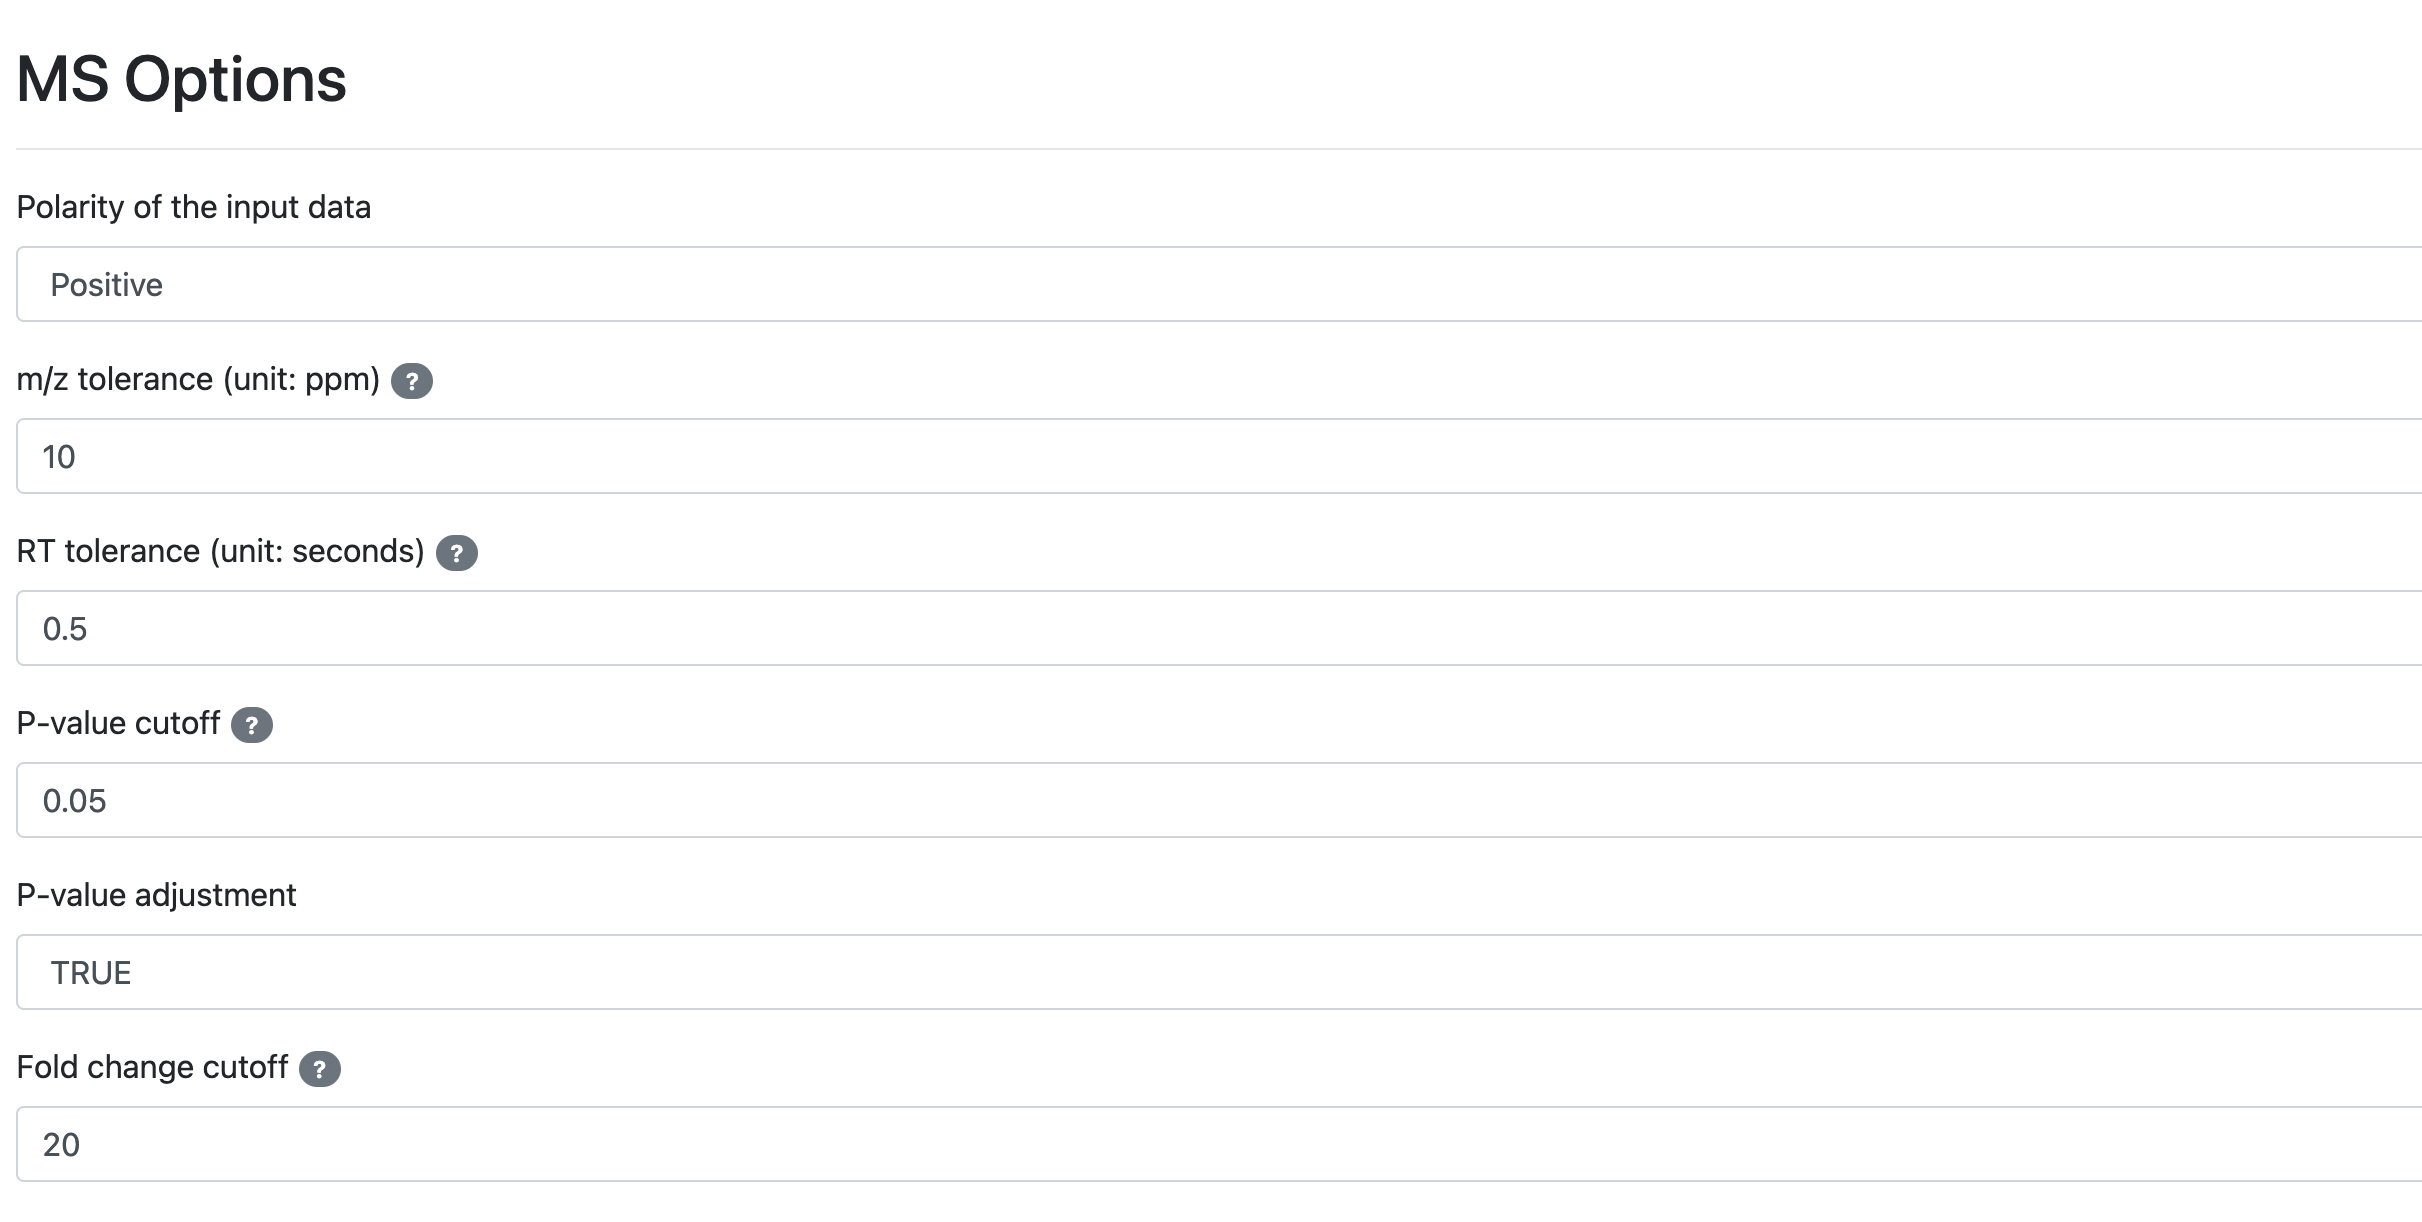
- Modify the IsoPairFinder workflow parameters according to your experimental design, and submit the workflow.
- polarity: ionization polarity, “positive” or “negative”. Default: “positive”
- mz_tol: m/z tolerance (unit: ppm) for searching the intermediate ions. Default: 10 ppm
- rt_tol: retention time tolerance (unit: minute) for searching the intermediate ions. Default: 0.05 min
- p_value_cutoff: the cutoff of p-value (t-test). Default: 0.05
- p_adjust: whether to perform the multiple comparison correction (FDR adjustment). Default: TRUE
- fold_change_cutoff: the cutoff of fold-change (case vs. control). Default: 20
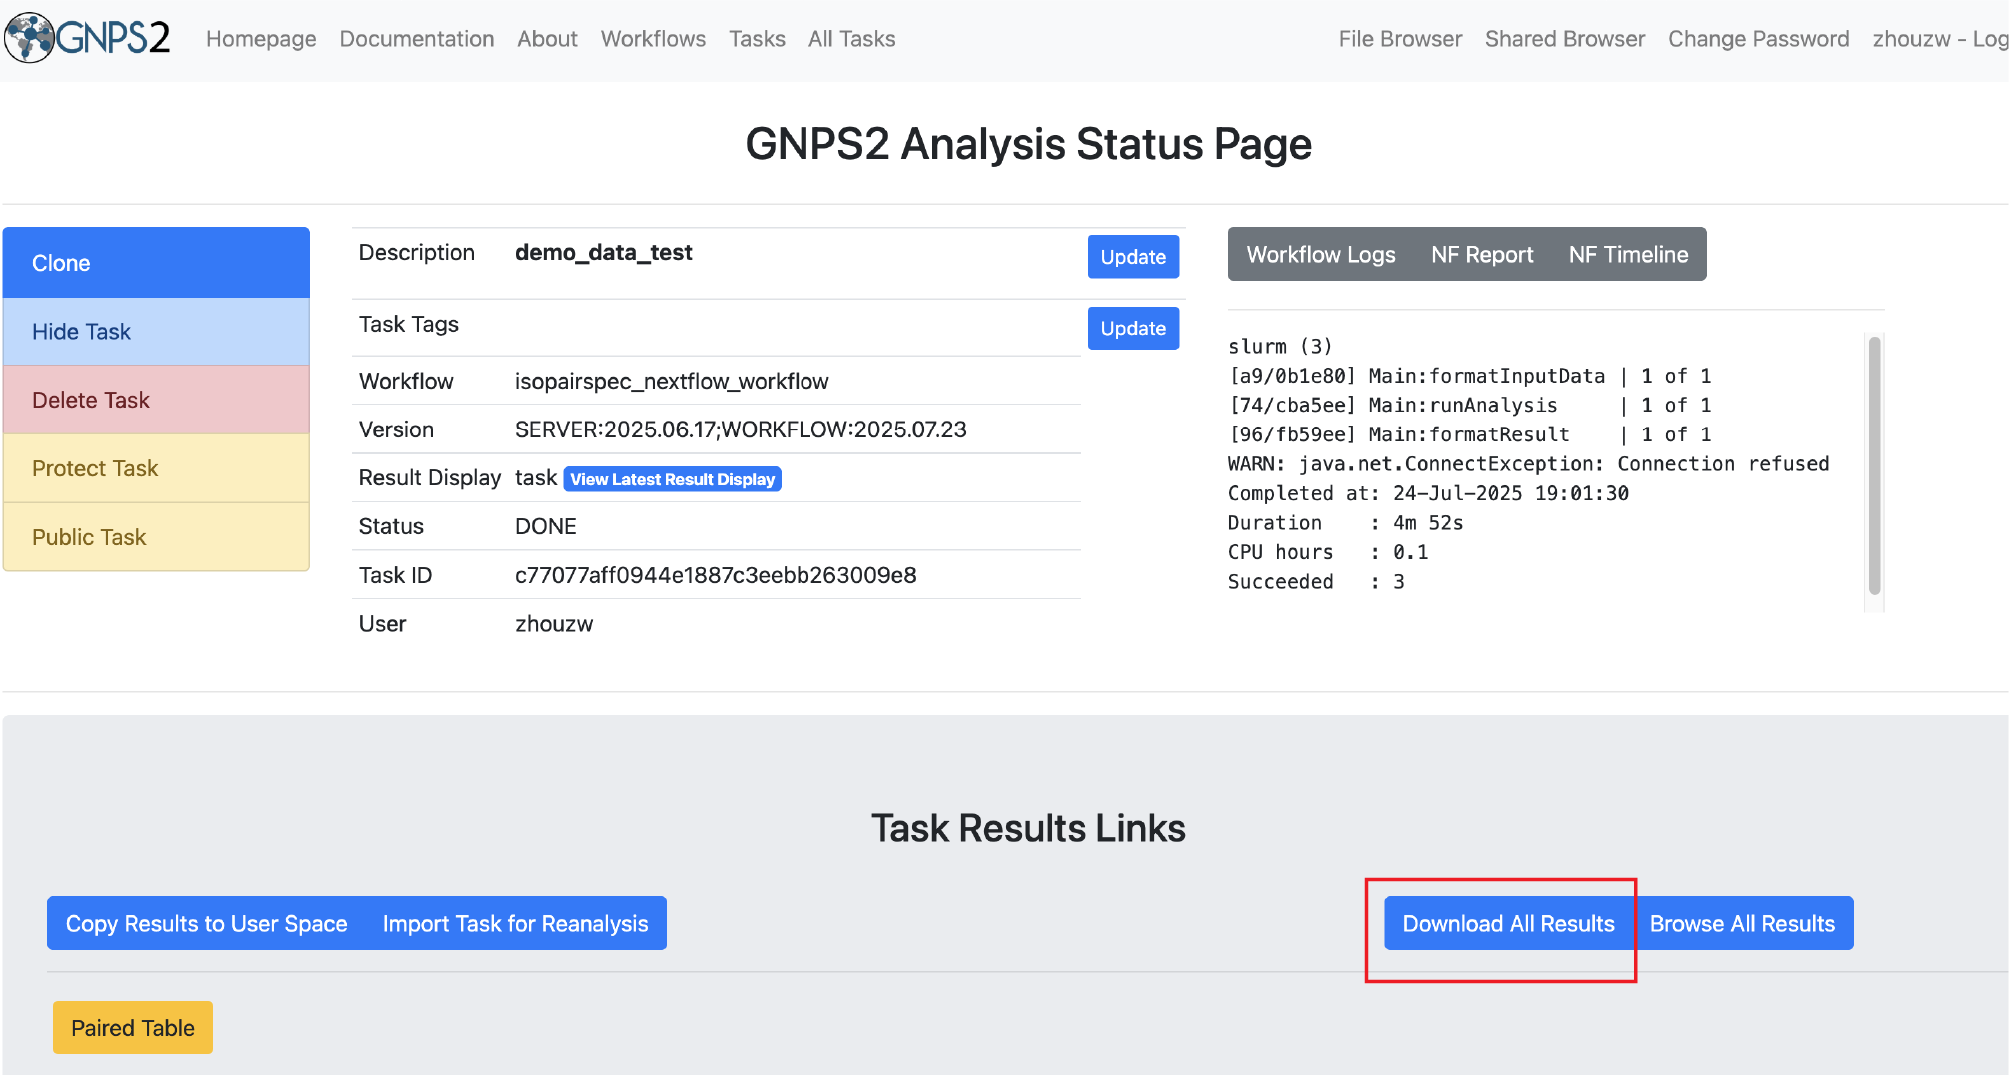
- Run the workflow and monitor its progress through the GNPS2 interface.
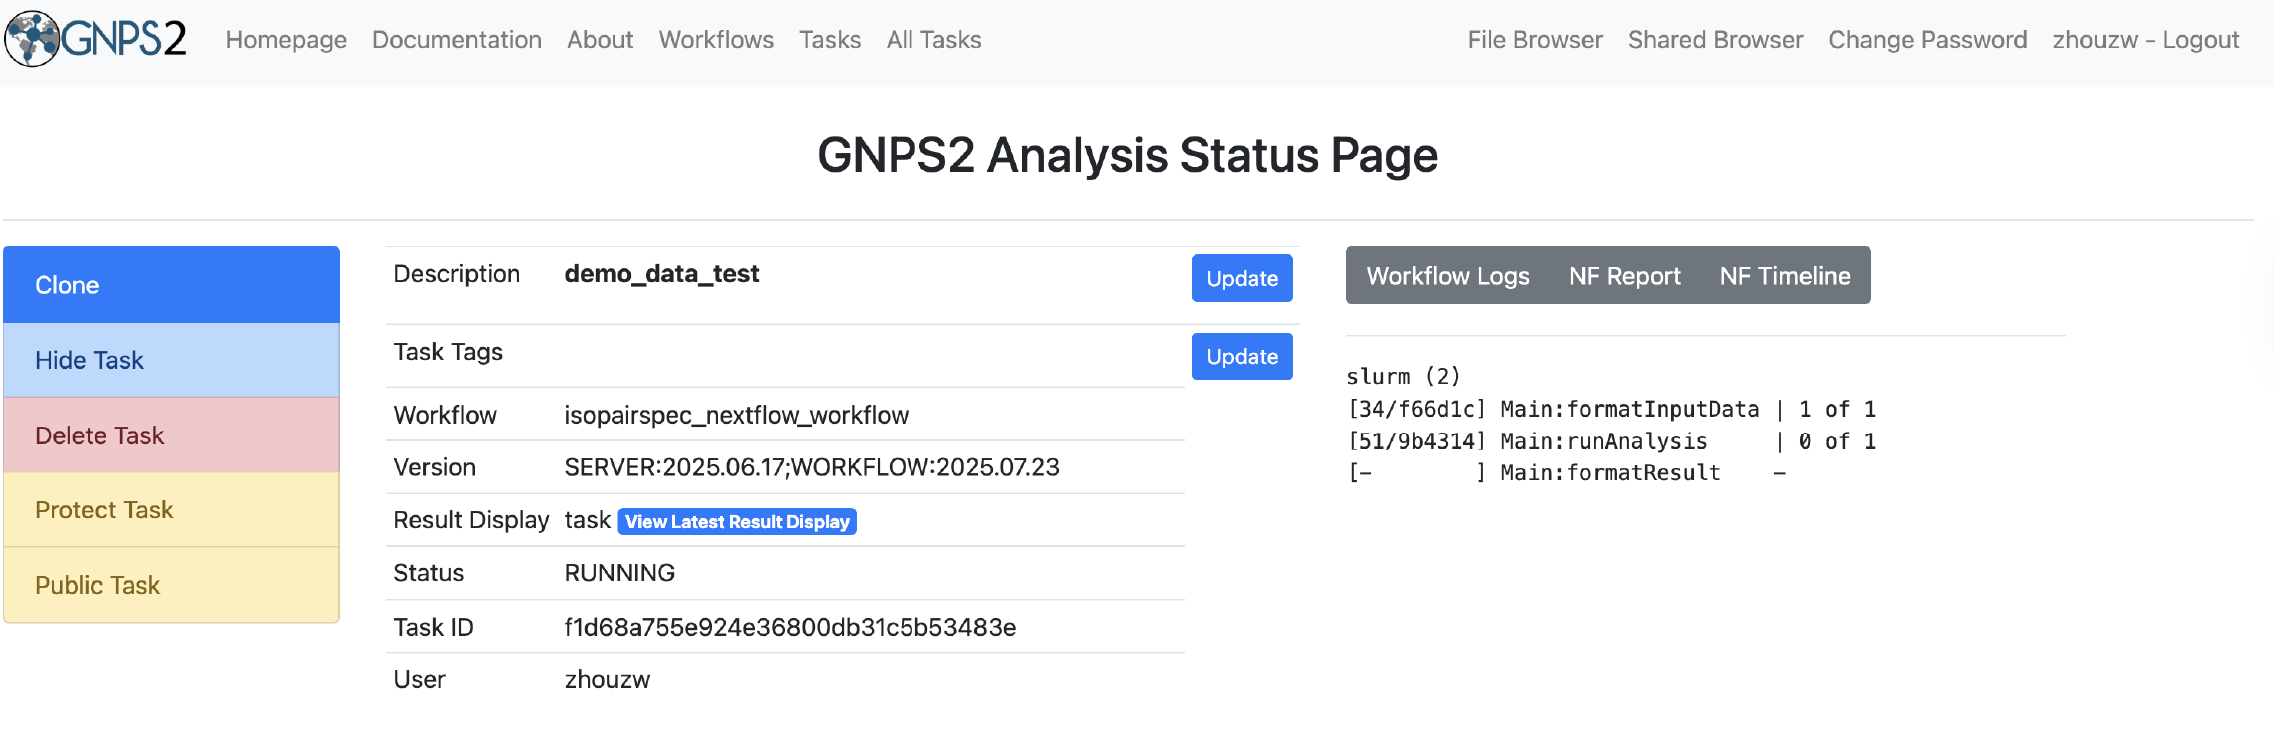
- Once the workflow is complete, download the results and analyze them using your preferred tools.
Output
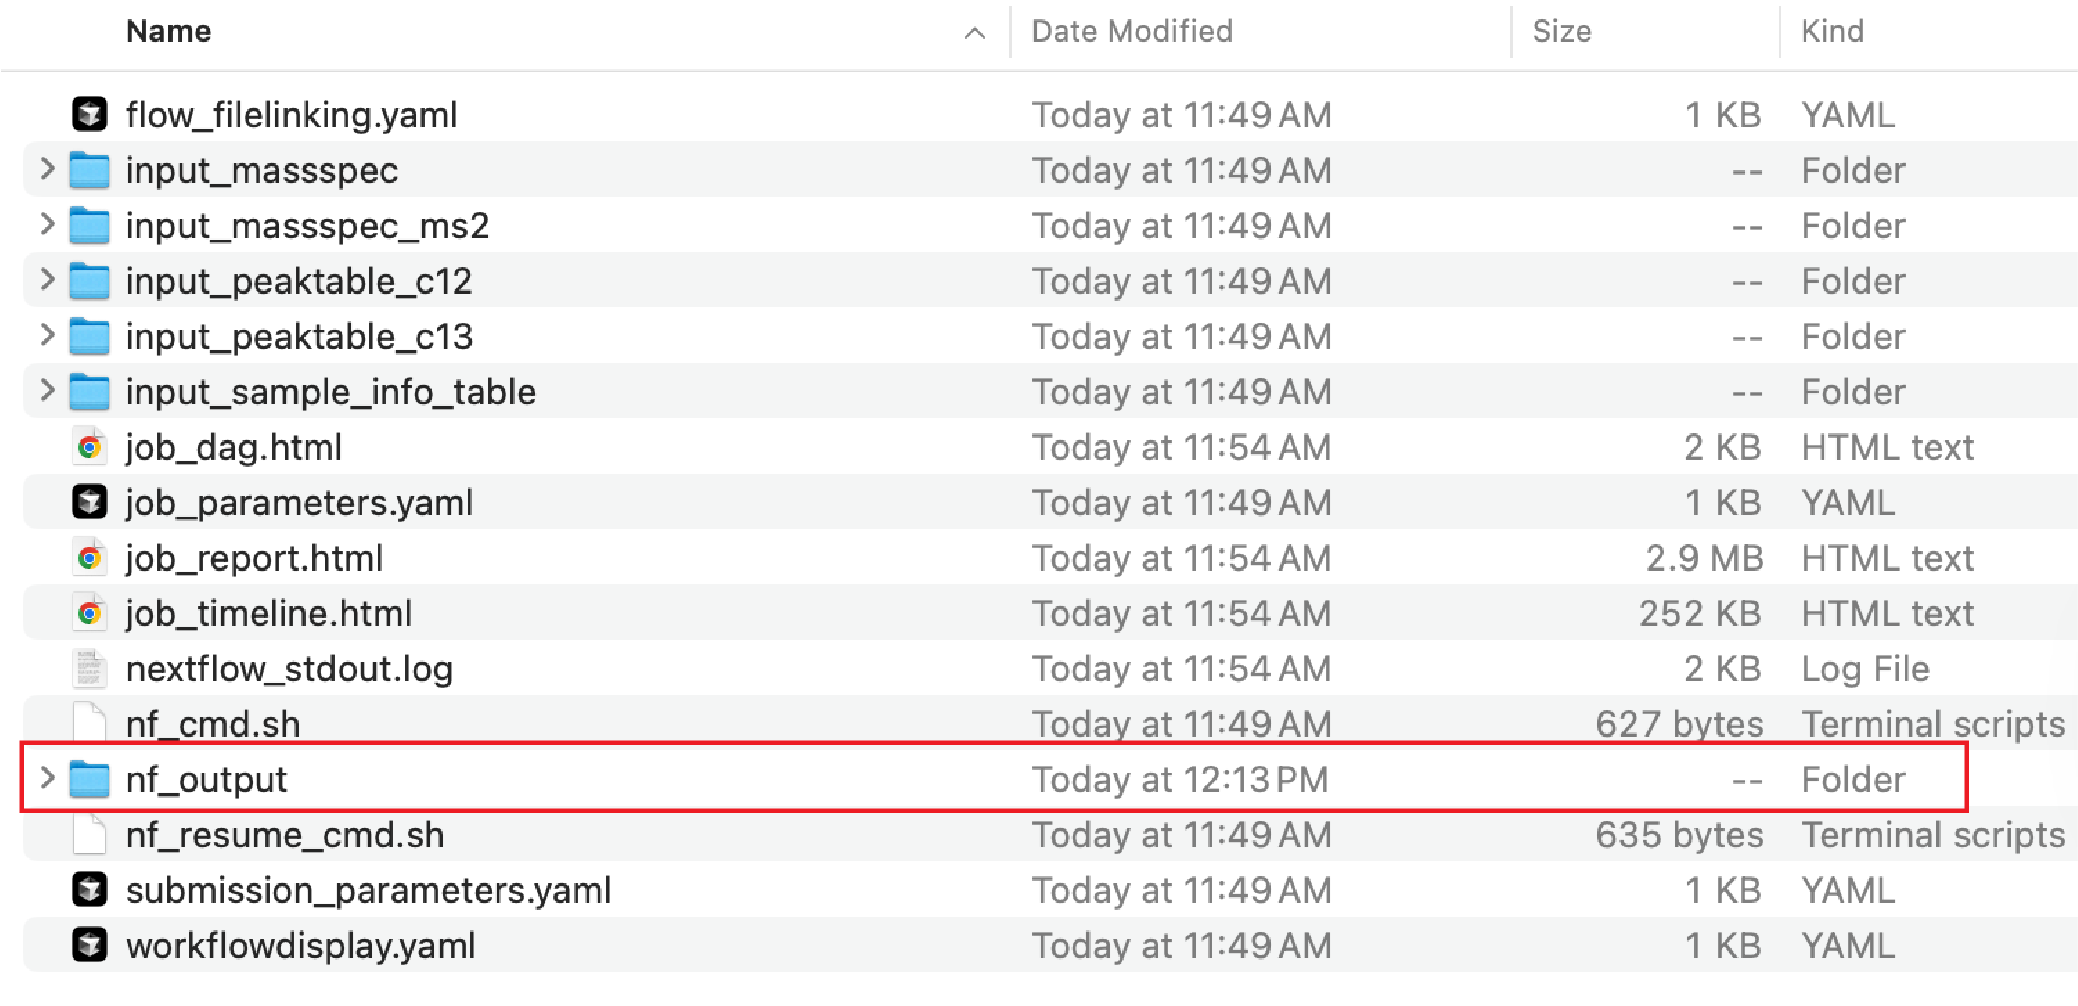
The exported results could be found in the output directory (Downloaded_folder/nf_output/Input/00_tracer_results) of the workflow:
These files will include (See the tutorials for more details):
- tracer_pair_result.xlsx: This file contains the results from differential analysis, recognized features, and identified pathway intermediate feature pairs. It has 4 sheets:
- raw_data_unlabeled: the differential analysis of the unlabeled group. Some columns below were added to the unlabeled feature table, including p-values, q-values, fold changes, etc.
- raw_data_labeled: the differential analysis of the labeled group. Some columns below were added to the unlabeled feature table, including p-values, q-values, fold changes, etc.
- recognized_peak_unlabel: the table of recognized adducts, neutral loss, and in-source fragments (@fig-figure3-2). The method used here was followed from a previous publication @zhou_metabolite_2022. Some key column definitions:
- base_peak: the base peaks that are used to recognize the adducts and in-source fragments.
- relationship: the relationship with the base peak.
- num_annotation: the number of features that belong to the same group.
- group_order: the feature group ID.
- paired_table: the table of possible pathway intermediate ion pairs identified. Each row represents one pair of pathway intermediate ions. Specifically,
- unlabeled_feature_id/mz/rt: the property (id, mz, rt) of pathway intermediate in the unlabeled group.
- labled_feature_id/mz/rt: the property (id, mz, rt) of pathway intermediate in the labeled group
- mass_shift_label: the estimated carbon number
- predicted_formula: the predicted formula of the pathway intermediate ion.
- p_values/fold_changes/average_abundance: the statistics of differential analysis
- “volcano_plot_unlabeled.pdf” / “volcano_plot_labeled.pdf”: the volcano plots that show a significant accumulation between the case (mutant) and control groups.
- “isotope_pair_plot_overview.pdf”: the overview of the EIC mirror for identified pathway intermediate ion pairs.
- “isotope_pair_list.pdf”: the lists of EIC mirror plots for identified pathway intermediate ion pairs.
Questions and Feedback
If you have any questions or feedback regarding the IsoPairFinder workflow, please feel free to reach out to us via the following channels:
- GitHub Issues: IsoPairFinder Issues
- Email: You can also contact us via email at zhouzw@stanford.edu